Is international trade fragmenting? Case study for EU Member States
This article examines how the concentration of international trade in goods has evolved for EU Member States over the last quarter of a century in terms of its territorial breakdown. Using the Herfindahl-Hirschman Index, we show that the trade concentration in most EU Member States fell slightly or stagnated in the previous period. In the group of new Member States, the decline in concentration was significant and continued until 2010. This outcome would suggest that global trade is not fragmenting. However, the dynamics of the Herfindahl-Hirschman Index mask a significant compositional effect – the decrease in the concentration index was due only to trade with countries with a similar geopolitical orientation. We divide countries into three geopolitical blocs based on voting data from the United Nations (UN) General Assembly. If we recalculate the Herfindahl-Hirschman Index for such broadly defined blocs, we find that for most EU Member States the concentration index started to rise slowly around 2015. This means that EU Member States are concentrating their trade in countries with similar geopolitical positions, which may be indicative of a creeping fragmentation of international trade.
Published in Global Economic Outlook – November 2023 (pdf, 1.8 MB)
Introduction and motivation
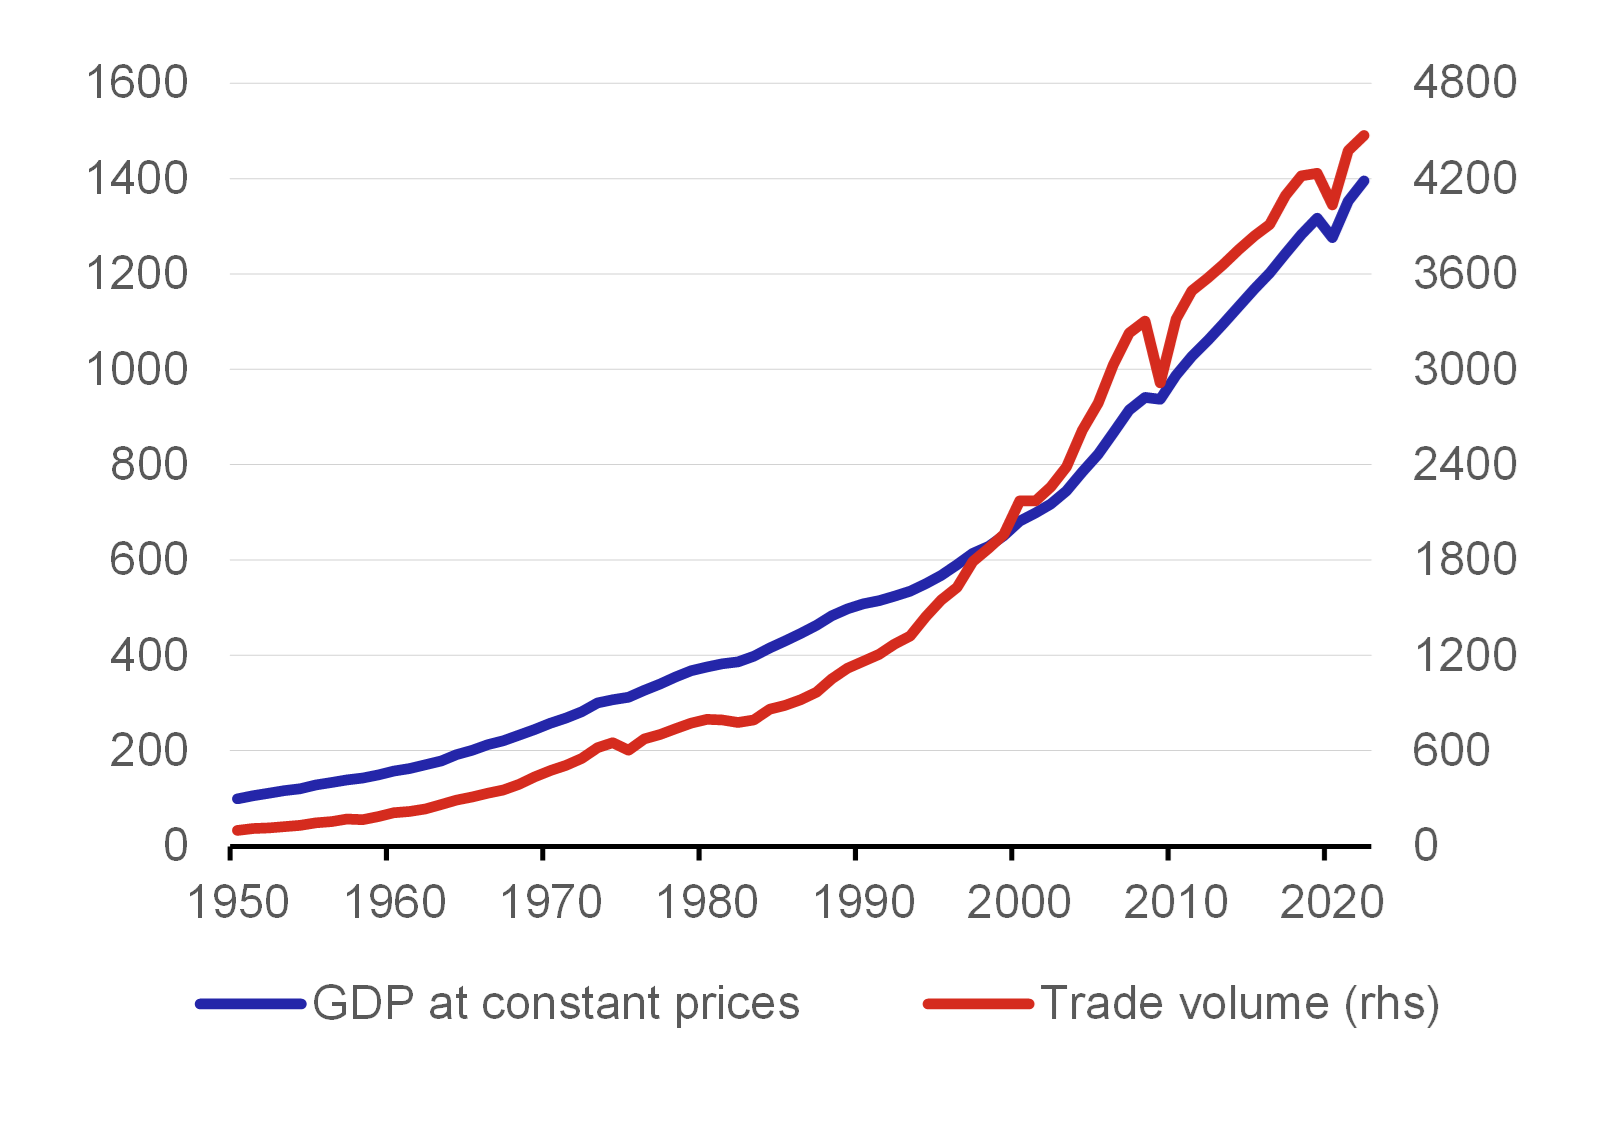
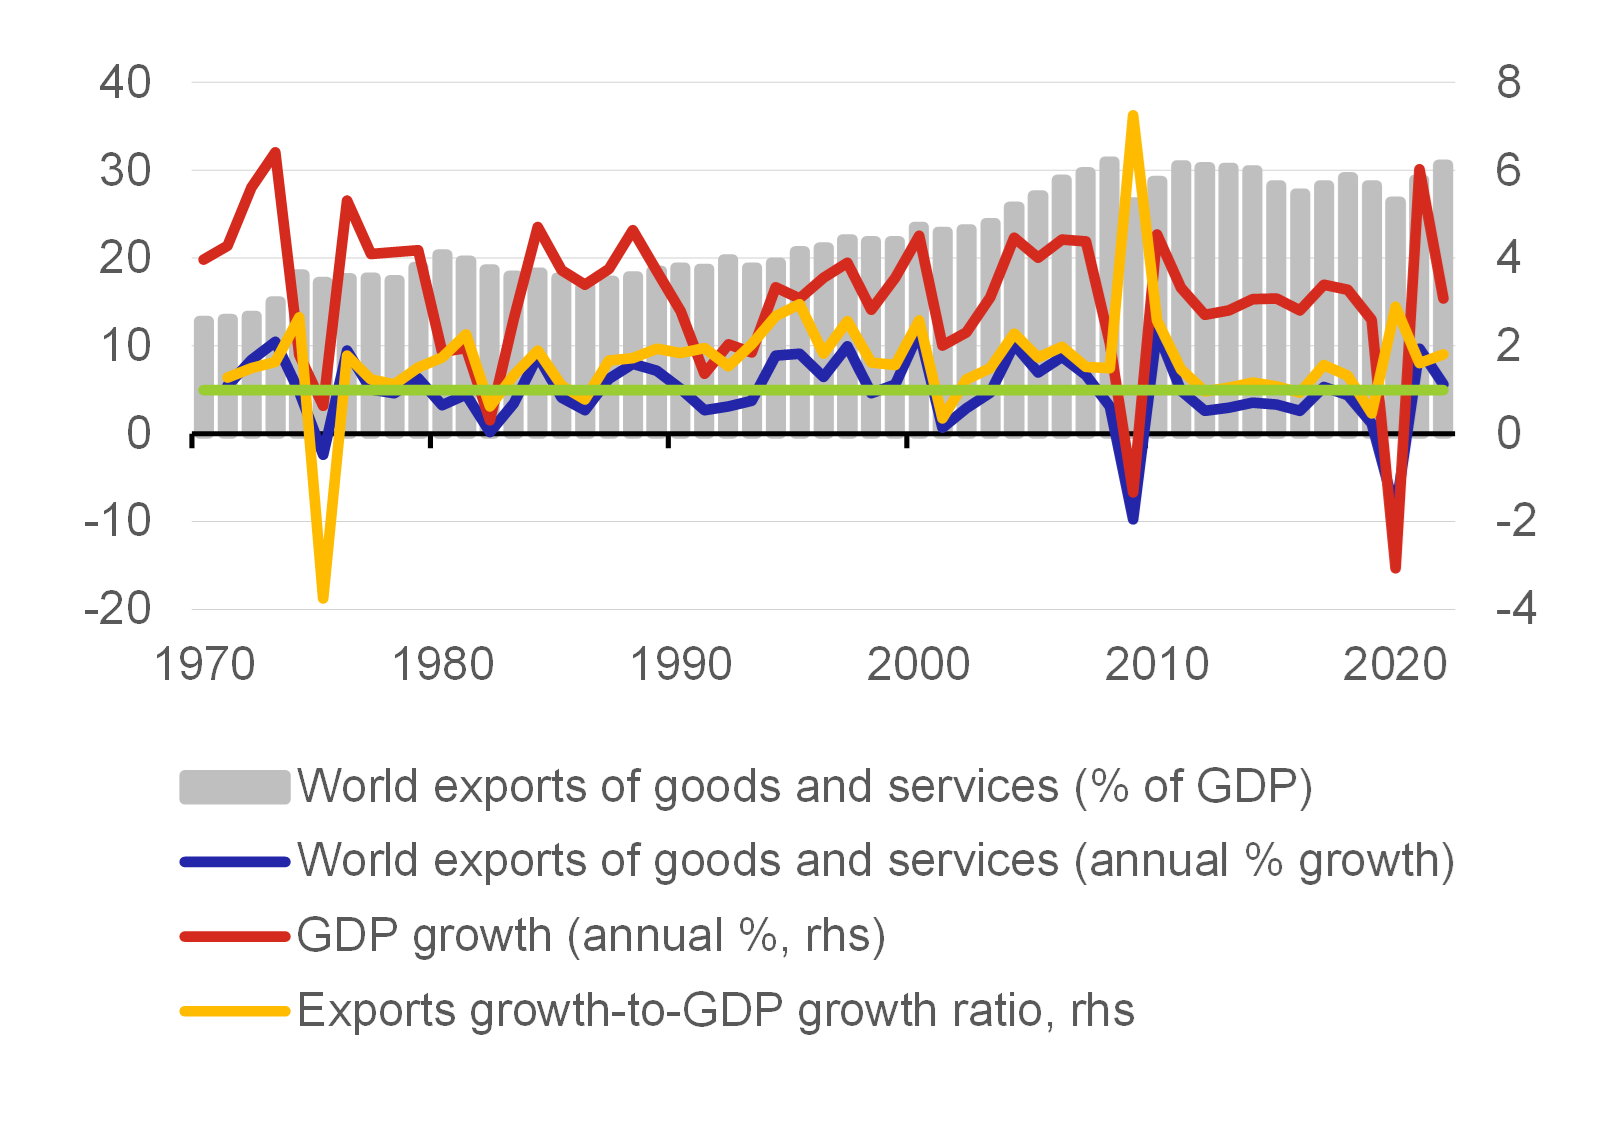
The growth in international trade can be seen as beneficial to people’s well-being around the world in many ways. Global international trade has grown by more than 4,300% since the end of World War II, while GDP growth has reached almost 1,300% (Chart 1).[1] Although the elasticity of global exports to GDP in real terms has fluctuated over time, it has mostly stayed above 1 (Chart 2) over the last 50 years, and has been close to 1.6–1.8 in recent years. Globalisation has enabled developing countries to participate in the international division of labour, thereby contributing to poverty reduction on a global scale (Bhagwati and Srinivasan, 2002, Aiyar et al., 2023) and at the same time bringing an influx of cheap products for developed countries (Fajgelbaum et al., 2020). Involvement in international trade has made it possible to free up the capacity of production factors for more productive activities (Rocha and Winkler, 2019). Supply chain disruptions would not only be costly for the real economy, but would also increase price growth (Attinasi et al., 2023).
Chart 1 – World trade and GDP at constant prices in 1950–2022
(index 1950=100)
Source: WTO, Our World in Data, World Bank WDI, authors’ calculation
Chart 2 – Growth in world trade and GDP at constant prices in 1970–2022
(% or ratio)
Source: World Bank WDI, authors’ calculation
Note: The green denotes value one on the right-hand-side axis.
Recently, international trade has been severely tested by newly created barriers and restrictions of a non-economic nature. First of all, the COVID-19 pandemic showed that disruptions to sophisticated production and supply chains cause economic problems not only for individual firms, but throughout entire sectors. Having recovered from the economic consequences of the pandemic, global growth and international trade subsequently began to face new risks and challenges, this time in the context of geopolitical frictions (Goldberg and Reed, 2023). Military conflicts have been taking place almost continuously throughout the history of mankind. According to the NY Times (2003), out of 3,400 years there have only been 268 completely without war, or only 8% of human history in this time period.[2] Geopolitical tensions have recently increasingly been perceived as a risk to global trade, and the possibility that they could lead to a reduction in international trade between countries with different positions cannot be ruled out. It is therefore important to examine whether international trade is fragmenting and the extent to which it is reflected in the data. Fragmentation would be reflected in an increase in the territorial concentration of international trade. In this article, we focus on EU Member States and examine whether the concentration of international trade in goods is increasing.
The standard measure of concentration is the Herfindahl-Hirschman Index, defined as the sum of the squares of the shares of groups of goods or trading partners, and can be summarized using the following formula:

where N is – for the purpose of this article – the number of trading partners and sn is the share of trading partner n in the total trade of the country under review. The index as such can range from 0/N2 to 1, where 0/N2 corresponds to perfect diversity (all the trading partners have equal shares) and 1 is complete concentration (the country trades with only one partner).
Despite its widespread use, the Herfindahl-Hirschman Index can mask important tendencies in concentration that may go unnoticed. This is because the dynamics of the index can be dominated by a group of trading partners. This can be shown formally as follows: let H be the index value for the set of indices I = {1, 2, . . . N}. Now suppose we have a rougher subdivision given by the set J = {J1, J2, . . . JK}, where Jk is the set of indices I such that J is a distribution of I (in our case, if the set I contains individual countries, the set J contains blocs of these countries). It is easy to verify that the Herfindahl–Hirschman Index H for the finer set I is related to the Herfindahl–Hirschman Indices Hk over the sets Jk as follows:

where is the share of the l-th partner in total trade. Thus, the Herfindahl–Hirschman Index H over the finer set I is the weighted sum of the Herfindahl–Hirschman Indices Hk over the sets Jk, where the weights are given by the sum of the squares of the share of the individual blocs. If a country mainly trades with countries in a particular bloc – let’s say Jk – the weight of that bloc  is much greater than the weights of the other blocs.
From this decomposition, it is clear that the dynamics of the overall index H can easily be dominated by the value of the index Hk for the most important bloc of trading partners. Explained intuitively, if a developed country trades mostly with other developed countries, the overall Herfindahl–Hirschman Index may have very similar dynamics to the Herfindahl–Hirschman Index calculated only over a subset of developed countries. If the index calculated over a subset of developed countries falls, the overall index calculated for all countries may also fall, even potentially in a situation where trade is concentrated between developed countries. In other words, the dynamics of the index may mask trade concentration in selected blocs.
To see whether this actually happens, we also calculate the Herfindahl-Hirschman Index for a rougher set of trading partners divided into three geopolitical blocs. This division is based on the countries’ voting at the United Nations General Assembly. Subsequently, we compare the Herfindahl–Hirschman Index for a fine classification (all trading partners) with the index for a rough classification (individual geopolitical blocs). The Herfindahl-Hirschman Index for trade in goods has been stable (or slightly falling) for most countries since 2012 due to stability or a fall in the concentration of trade with other developed countries. Despite this, EU Member States’ trade has been concentrated on a specific set of countries. In other words, international trade has been regionalised.
This result distinguishes our article from other studies that have not found significant fragmentation of global trade in the data and have so far understood it rather in terms of risks. Such a conclusion is reached by Goldberg and Reed (2023), and Gaál et al. (2023), who see signs of fragmentation but still rather at the level of auxiliary indicators than “hard” data. Similarly, Sano et al. (2023) based on the division of countries by continent (Europe, Asia, America, Africa, Australia and Oceania), there are no signs of a rise in trade concentration. The concentration index for such geographically defined blocs is rather stable over time and fragmentation is also perceived as a risk for the time being. We, on the contrary, argue that fragmentation is already visible in the data if the right data view is used, i.e., through geopolitical blocs rather than through a purely geographical breakdown.
Data
Eurostat is the source of trade data for cross-border trade in goods. Annual data are available for 1999–2022. The analysis focuses on trade inside and outside the current EU27, where the EU Member States are considered to be the statistical territory of each Member State, which is predominantly the customs territory. EU Member States trade with around 250 countries and territories for which at least one year’s worth of data is available. This number also reflects geopolitical changes over time, such as the break-up of some countries (e.g., Serbia and Montenegro), the emergence of new independent states (South Sudan, East Timor) and political entities with questionable international status (Taiwan, Kosovo, the Palestinian territories, etc.). For the purposes of this article, we look not only at the aggregate, but also at the individual categories of goods aggregated according to the BEC (Broad Economic Categories) classification, which classifies goods by the degree of processing. There are more entities included in international trade statistics than countries in the United Nations. The text below sets out the manner in which we match these two sets.
To divide countries into geopolitical blocs, we use voting records from the United Nations General Assembly. We have acquired data on voting on UN resolutions from January 2022 to August 2023. The overall dataset contains information on 96 votes. A country can vote for a resolution, against it, abstain or not vote.[3]
We use an archetypal analysis to classify countries. Archetypal analysis was first introduced by Cutler and Breiman (1994) and is an unsupervised machine learning algorithm. Its goal is to find “archetypes” representing “pure” patterns in the data. At the same time, each observation can be expressed as a combination of archetypes – one can say how close a particular observation is to any archetype.[4] The observations can then be divided into groups according to their proximity to the individual archetypes. Each group includes the countries that are closest to a specific archetype.
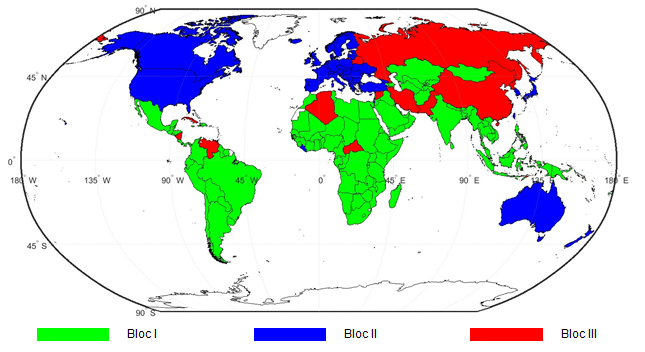
Our analysis of the voting in the United Nations General Assembly reveals four major archetypes, which indicate the similarities or differences in voting by individual countries.[5] So we can divide countries into four groups on the basis of their voting. What are these groups? The first group of countries consists of 118 primarily developing countries. The second group consists primarily of developed countries (except the USA and Israel), as well as countries aspiring to join Western political structures (e.g. the EU or NATO) and their geopolitical allies. The third group is a small group of 12 countries concentrated around Russia, China and Iran. The smallest fourth group consists of the USA, Israel and several small countries. One feature of this fourth group is the voting on Middle East issues, which distinguishes this group from the others. The USA and Israel usually vote on resolutions related to Israeli-Palestinian issues or the Israeli-Syrian conflict in the opposite way to other developed countries. On other resolutions, the USA and Israel tend to vote in a similar way as other developed countries.[6] Therefore, for the purposes of this article, we have grouped the fourth and second groups of countries together. This results in the following three geopolitical blocs of countries,[7] see Chart 3.
Chart 3 – Dividing countries into groups by archetypes
Source: Authors’ calculation according to the OSN data
Results of the analysis
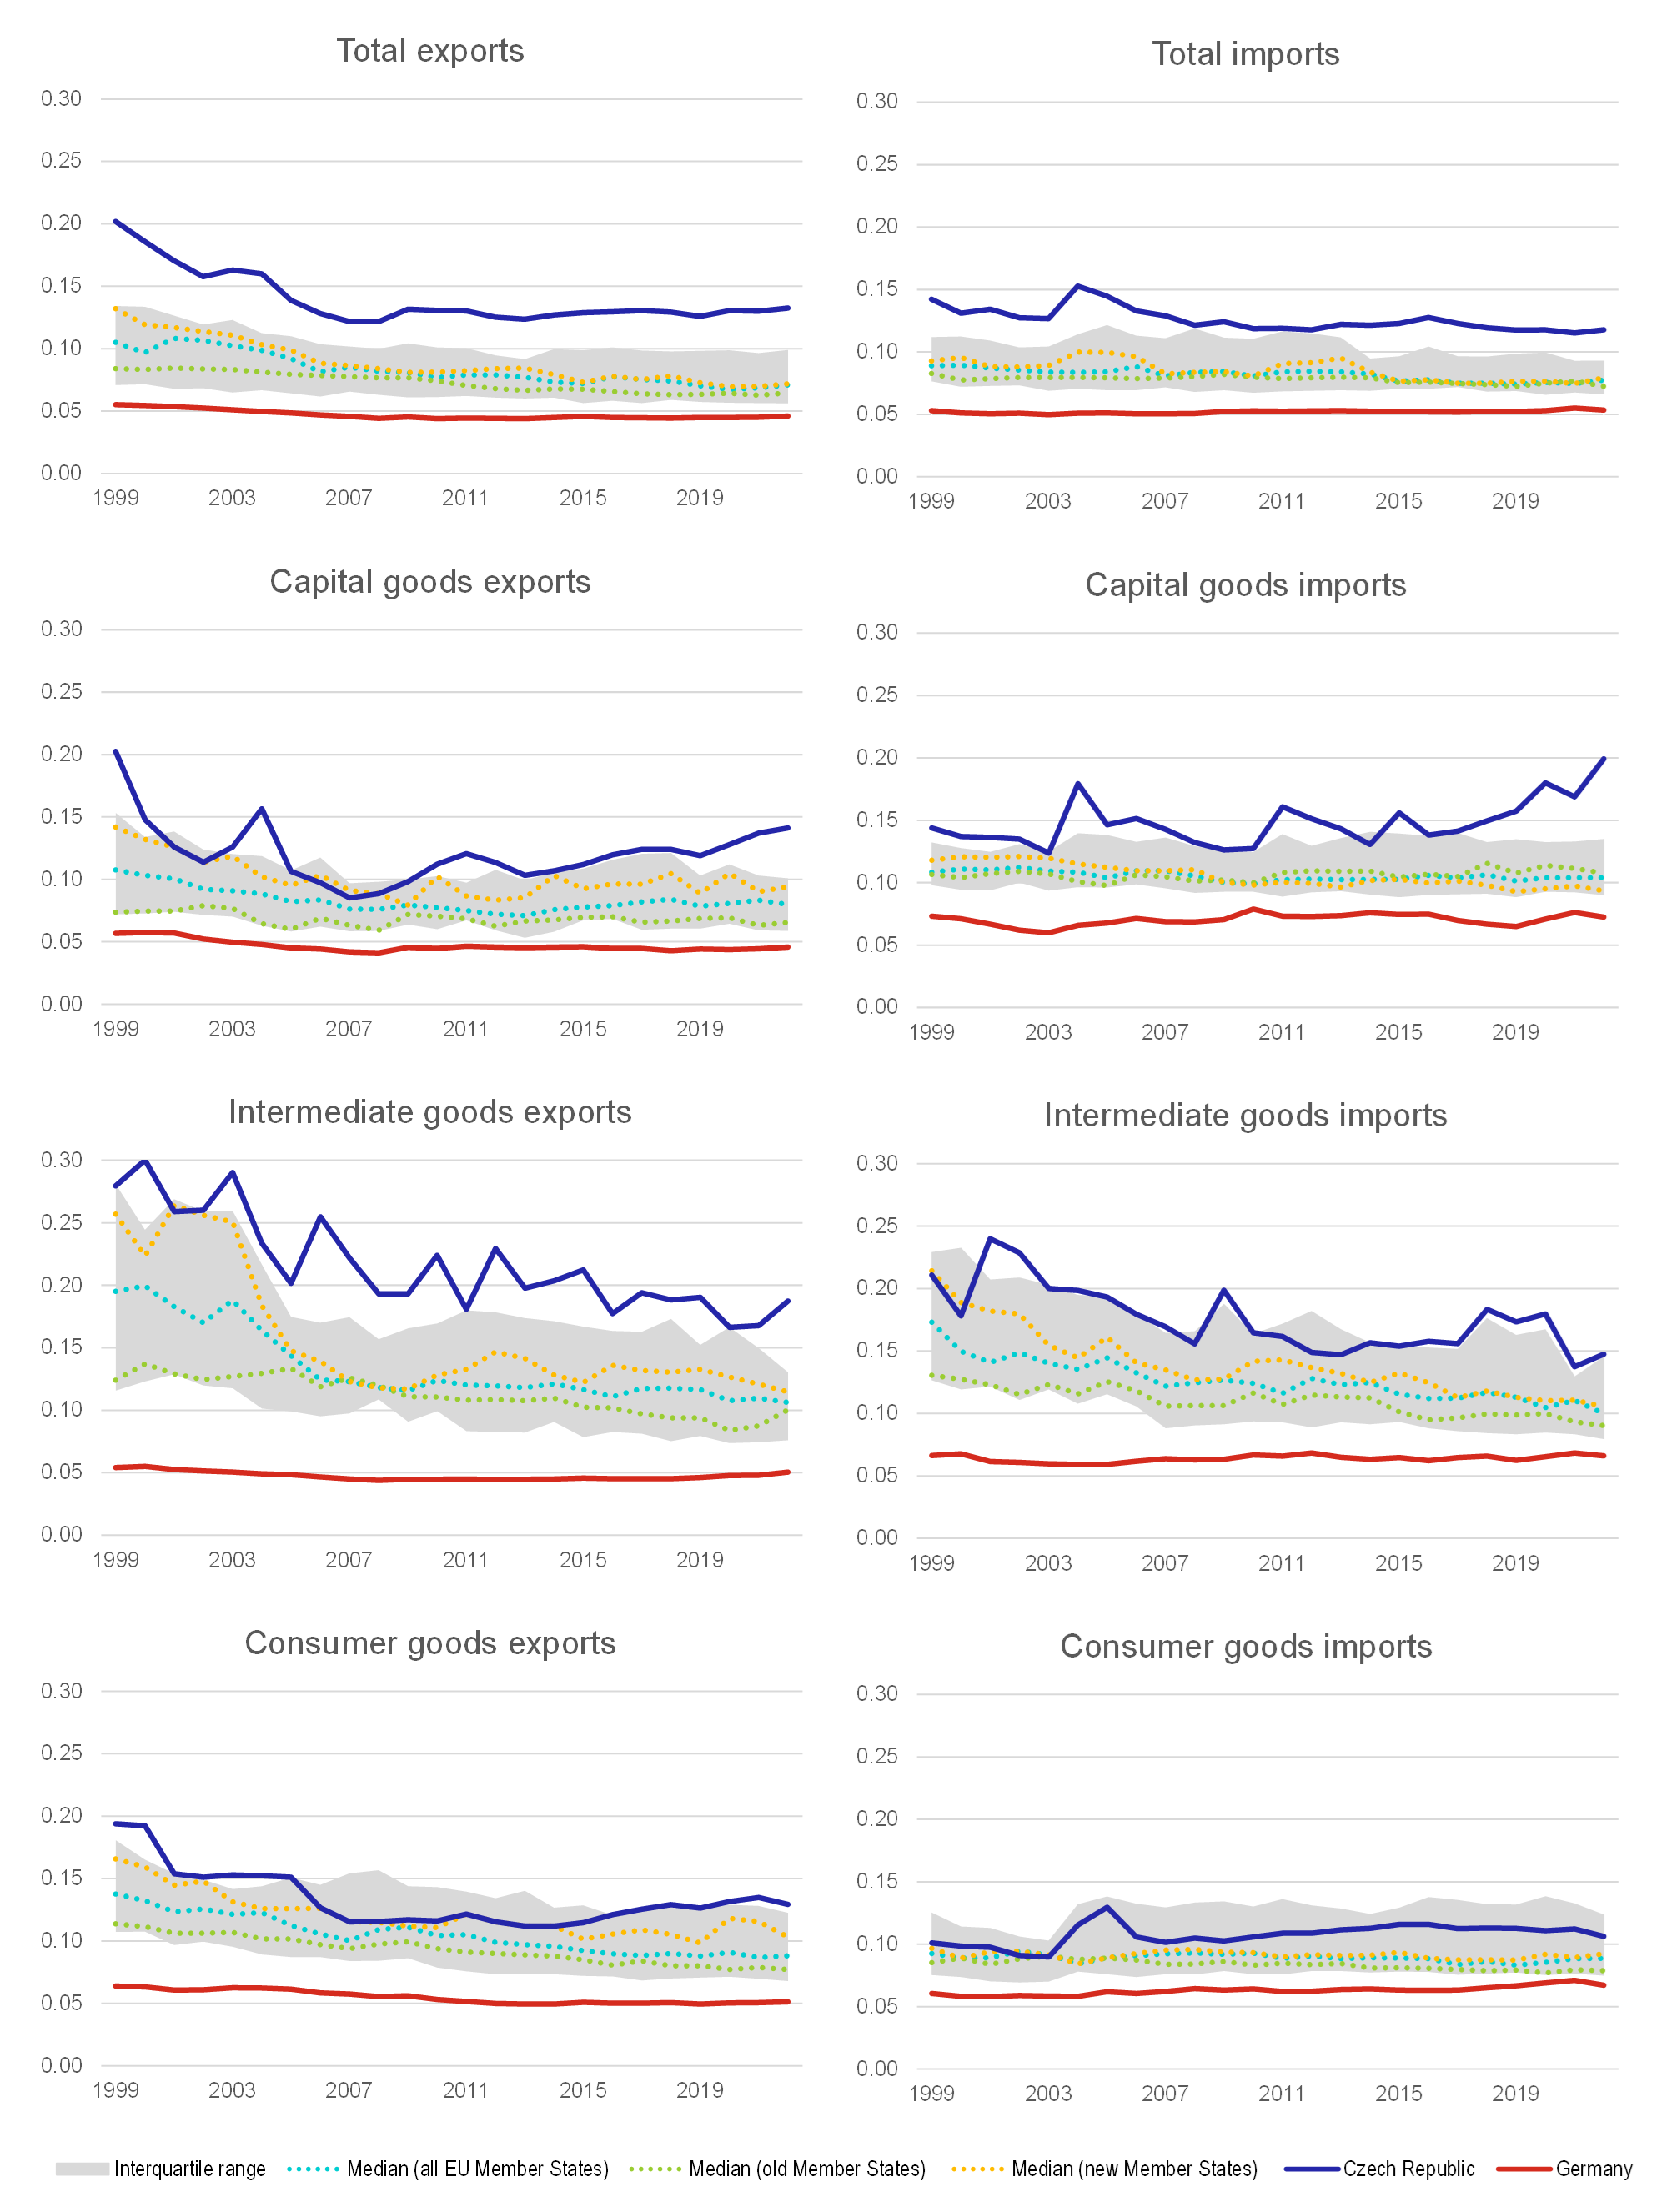
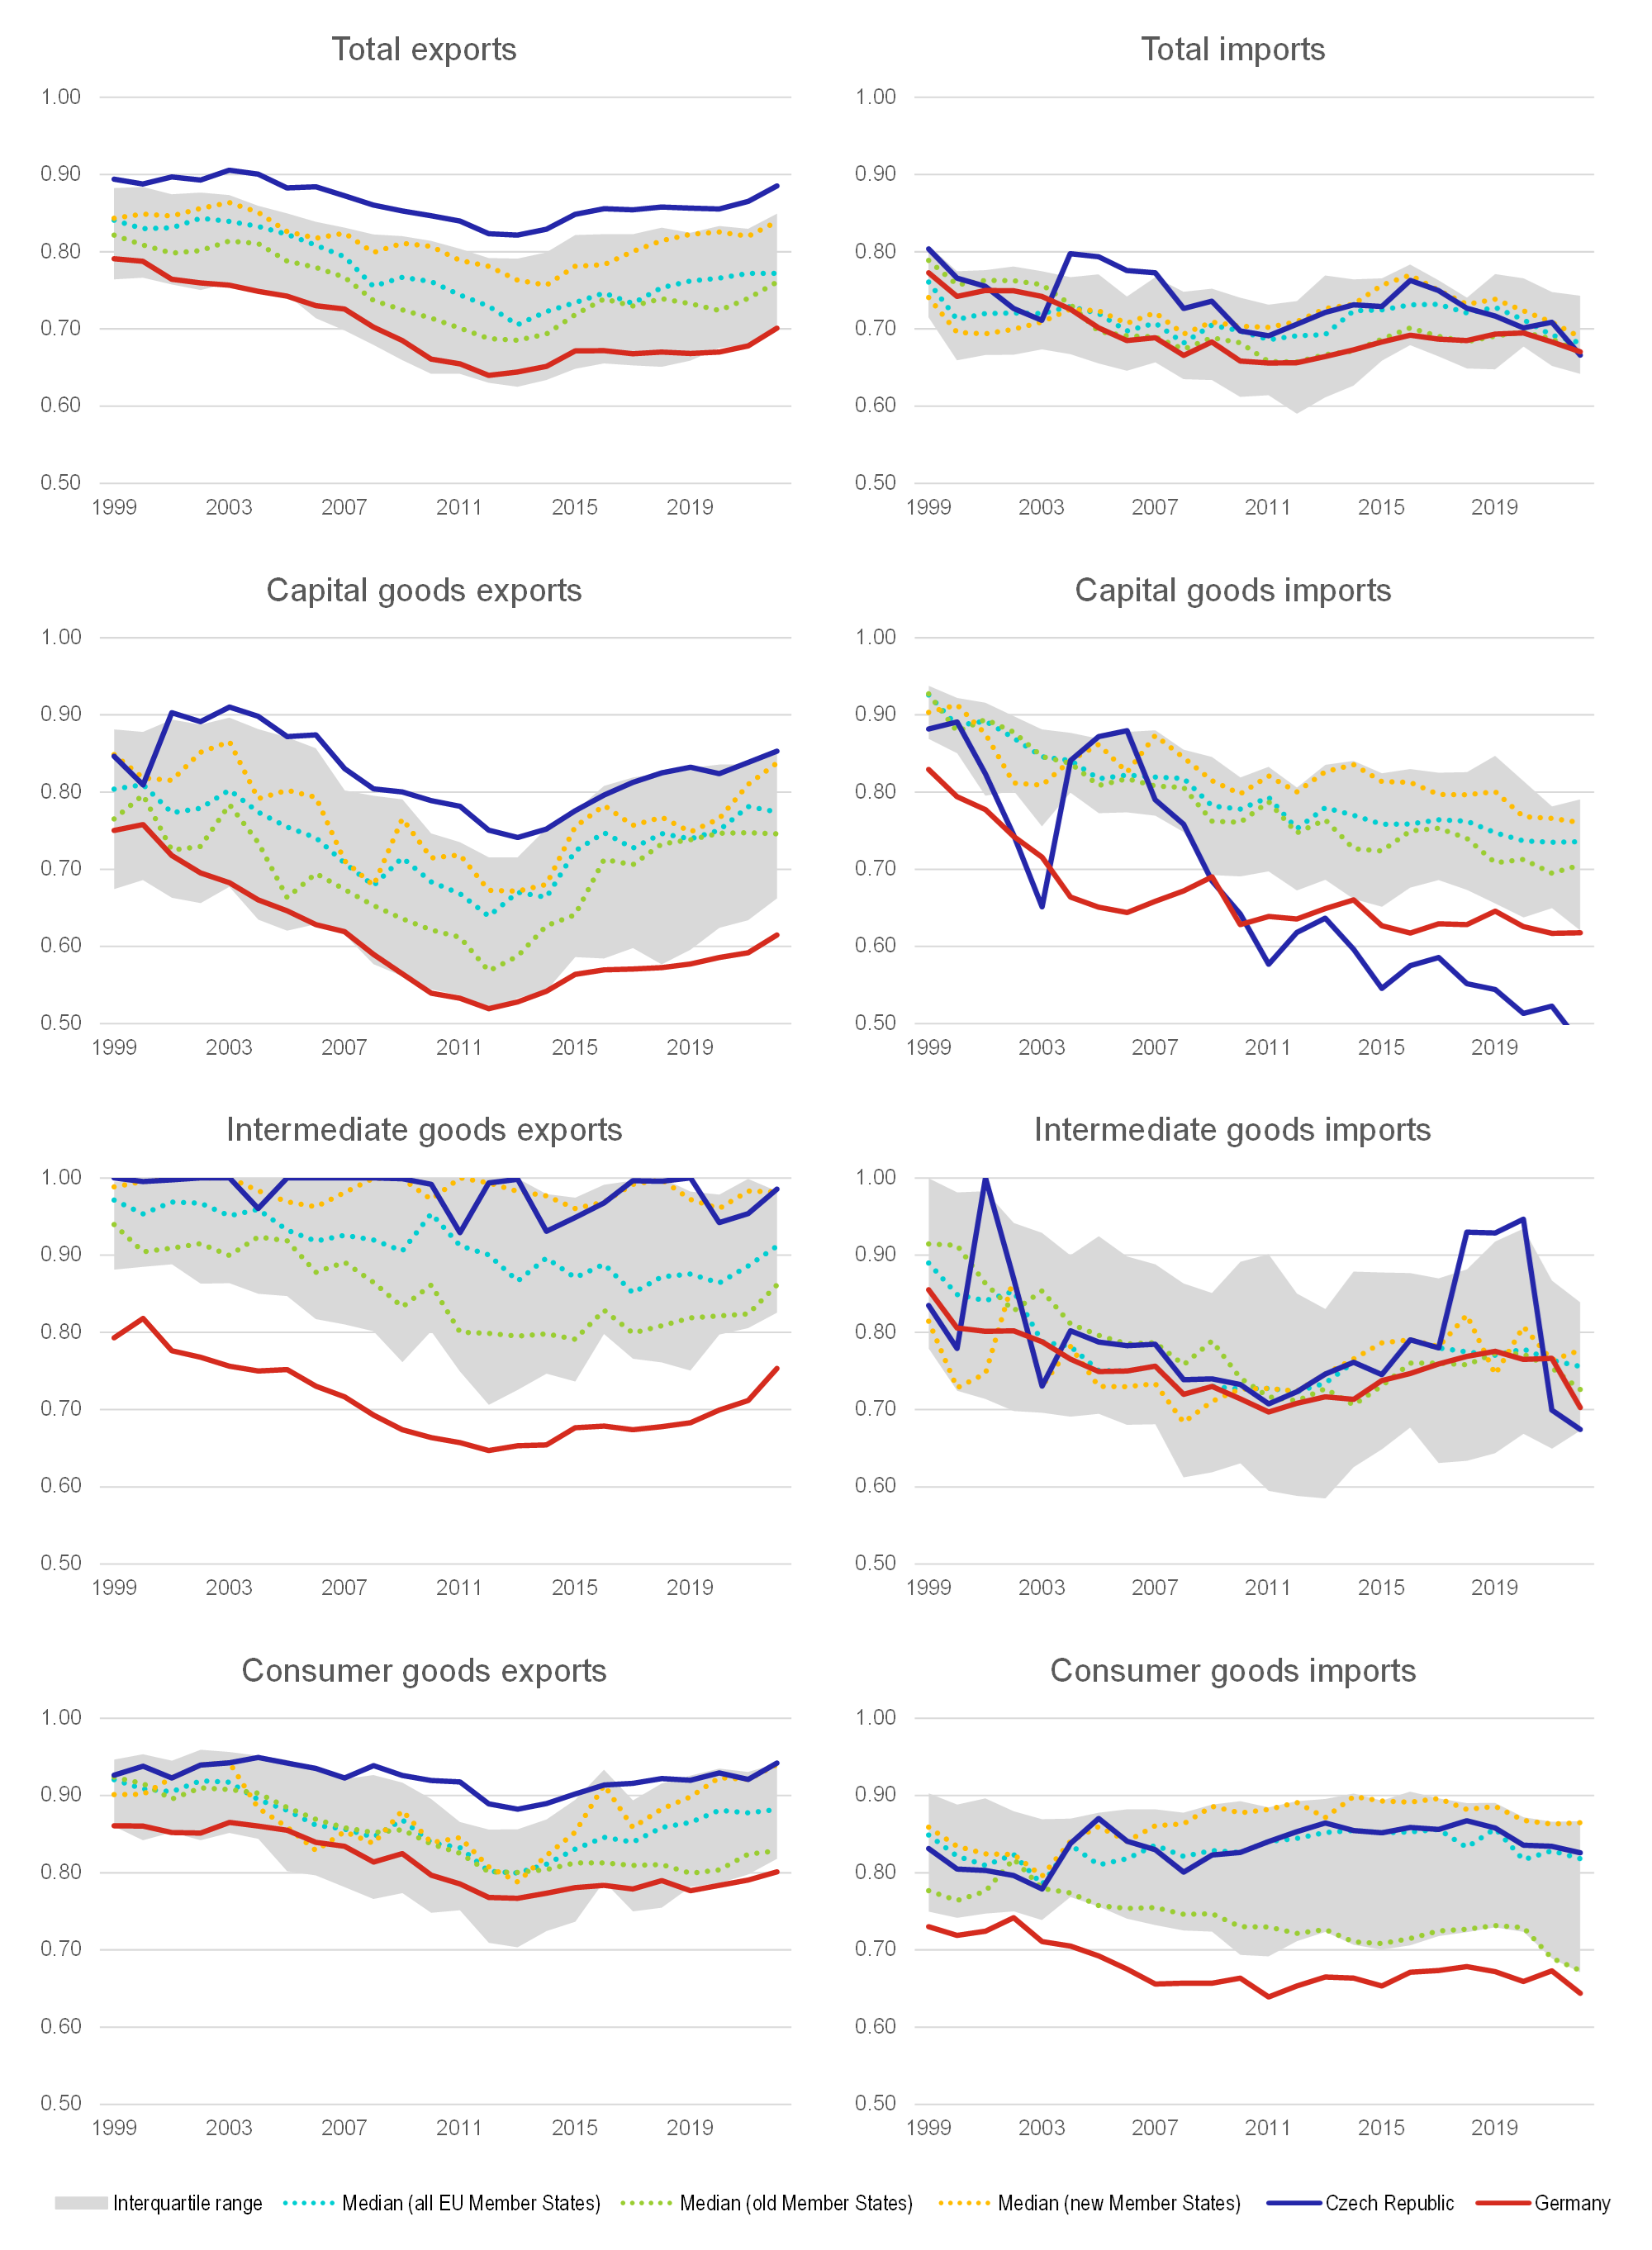
Chart 4 shows the Herfindahl-Hirschman Index indicating the concentration of foreign trade for individual trading partners. On each sub-chart, we present the median for all EU Member States, the median for the old Member States (i.e. those that joined the EU before 2004) and the median for the new Member States (i.e. those that joined the EU after 2004). The interquartile range is also presented, plus the index value for the Czech Republic (as a representative of the new Member States) and the index value for Germany (as a representative of the old Member States and also the largest European economy).
The concentration of international trade, as measured by the Herfindahl-Hirschman Index, is stable or decreasing for EU Member States for both total exports and imports. In terms of total exports, the value for the old Member States shows no significant trend, as evidenced by both the stable value of the index for Germany and the median value for the old Member States. For the new Member States, the index is falling in most cases, with the bulk of the fall taking place in the first half of the period under review, i.e. before 2010. The concentration of Czech exports shows a trend typical for other new Member States, although the index is above the median level, indicating an increased concentration for Czech total exports. A qualitatively similar conclusion applies to total imports, while the fall in the concentration of imports is more gradual for the new Member States than in the case of exports. Trade in consumer goods gives a similar conclusion regarding the dynamics of the index’s concentration. In the case of trade in capital goods, the concentration over time is stable (old Member States) or falling (new Member States). Without a clear concentration trend, the Czech Republic is an exception.
As regards trade in intermediate goods, there is a downward tendency in concentration for both exports and imports in both the new and old Member States. This fall in concentration is more pronounced in the new Member States and for exports, yet applies to both sides of trade and also to the majority of EU Member States. At the turn of the millennium, the index for trade in intermediate goods was significantly higher for the typical EU Member State than for total trade, but moved closer to the levels for total trade over time. At the same time, the index dynamics are more volatile,[8] with larger differences across countries at the index level than in the case of total trade. For Member States where there has been no visible fall in concentration (e.g. Germany), the index remains stable.
Do these conclusions apply even if we look at foreign trade concentration via more broadly defined groups, i.e. geopolitical blocs? No, this is not the case. Chart 5 shows the Herfindahl-Hirschman Index for foreign trade concentration defined via geopolitical blocs reflecting the analysis in the previous section of the text. Chart 5 is organised in the same way as Chart 4 in all other aspects.
Exports saw a decline in concentration defined via geopolitical blocs until 2010, but the trend has been reversing since 2012. This applies to both old and new Member States, and for both total exports and individual groups. The most significant trend can be seen in capital goods exports. Intermediate goods exports are highly concentrated: EU Member States export these goods to a large extent only to bloc II countries (i.e. to friends from the same geopolitical bloc). In some countries (among them the new Member States, including the Czech Republic), this concentration is high and close to 1, which in other words means that these countries export intermediate goods almost exclusively to bloc II countries.[9]
In terms of imports, the trade concentration situation is more complex for geopolitical blocs. The concentration of capital goods imports is falling over time, making capital imports more diversified over time. Imports of intermediate goods have a U-shape for the typical EU Member State: concentration fell until 2010 and then slowly increased. As a result, intermediate goods are now imported into most EU Member States from the friendly geopolitical bloc II to a greater extent than 10 years ago. The index values for imports of goods for consumption are either stable (which typically applies to the new Member States) or are falling over time. Thus, in the case of imports of consumer goods, we do not see a reversal in the concentration of imports, unlike with intermediate goods. The concentration index for total imports via geopolitical blocs thus reflects these opposing tendencies and shows a slightly downward trend for most countries over time.
Conclusion
In this article we document the falling concentration of international trade for EU Member States. We show that the concentration of international trade has been either stable or even falling over time since the end of the last millennium. This result could be reassuring: global trade fragmentation is not yet under way, and both rich and developing countries can thus reap the benefits of the international division of labour.
However, the falling concentration of international trade masks important compositional effects. Based on voting by countries in the UN General Assembly, we defined three geopolitical blocs and analysed the concentration of trade for each bloc. It appears that over the last 10 years, EU exports have been concentrating on a friendly geopolitical bloc. In the case of imports, this situation is not so obvious, yet – at least in the case of intermediate goods – the share of imports from the same geopolitical bloc is also increasing.
From the geopolitical perspective, there are thus slight and creeping signs of fragmentation of foreign trade. If these trends continue, it could mean a fall in the benefits of global trade, including a decline in productivity and output growth. This would put an end to the trends that have brought about gains in well-being for many people around the world. Empirical studies (Attinasi et al., 2023) show that the fragmentation of world trade would likely lead to an increase in the prices of certain inputs, which could foster inflationary pressures in the short term (not in the long term, as this would “only” be a change in relative prices in the long term). It is therefore desirable to continuously monitor and assess the international trade situation.
On the other hand, it is worth noting that trade concentration in countries with similar geopolitical positions may have indirect benefits. These may consist in the fact that trade and production chains would be less exposed to risk and the possibility of blackmail from other countries in the event of adverse geopolitical events.[10] Thus, beyond a purely economic perspective, the fragmentation of trade is not a clear cost.
Written by Oxana Babecká Kucharčuková and Jan Brůha. The views expressed in this article are those of the authors and do not necessarily reflect the official position of the Czech National Bank.
Sources
Attinasi M.-G., Boeckelmann L., Meunier B. (2023): “Friend-shoring global value chains: a model-based assessment”, Economic Bulletin, ECB, Issue 2.
Aiyar S., Chen J., Ebeke C., Garcia-Saltos R., Gudmundsson T., Ilyina A., Kangur A., Kunaratskul T., Rodriguez S., Ruta M., Schulze T., Soderberg G., Trevino J. (2023): Geoeconomic Fragmentation and the Future of Multilateralism. IMF Staff Discussion Notes No. 2023/001.
Babecká Kucharčuková O., Brůha J. (2020): A tale of two crises: An early comparison of foreign trade and economic activity in EU Member States. GEO thematic article, September 2020.
Brůha J., Babecká Kucharčuková O. (2017): An Empirical Analysis of Macroeconomic Resilience: The Case of the Great Recession in the European Union, CNB WP Series 10/2017.
Bhagwati J., Srinivasan, T. N. (2002): Trade and Poverty in the Poor Countries. American Economic Review 92 (2): 180–83.
Cutler A, Breiman L. (1994): Archetypal Analysis. Technometrics, 36(4), 338–347.
Di Sano M., Gunnella V., Lebastard L. (2023): Deglobalisation: risk or reality? ECB blog. https://www.ecb.europa.eu/press/blog/date/2023/html/ecb.blog230712~085871737a.en.html
Eugster M.J.A, Leisch F. (2009): From Spider-Man to Hero – Archetypal Analysis in R. Journal of Statistical Software, 30(8), 1–23.
Fajgelbaum P.D., Goldberg P.K., Kennedy P.J., Khandelwal A.K. (2020): The Return to Protectionism. The Quarterly Journal of Economics, 135 (1): 1–55.
Gaál N., Nilsson L., Perea J. R., Tucci A., Velázquez B. (2023): Global Trade Fragmentation. An EU Perspective. Economic Brief 075, September.
Goldberg, P.K., Reed T. (2023): Is the Global Economy Deglobalizing? And if so, why? And what is next? Brooking Papers on Economic Activity.
Hedges Ch. (2003): What Every Person Should Know About War. The New York Times (nytimes.com), 6 July 2003.
Lichtenstein E. (1976): Slovo o nauke (A word about science), Znanie.
Maddison Project. University of Groningen. Maddison historical statistics, University of Groningen (rug.nl).
Rocha N., Winkler D. (2019): Trade and Female Labor Participation: Stylized Facts Using a Global Dataset. Policy Research Working Paper No. 9098. World Bank, Washington, DC.
United Nations (2016): Classification by Broad Economic Categories Rev.5, Statistical Papers Series M No.53, Rev.5.
Chart 4 – Herfindahl-Hirschman Index calculated for individual trading partners
(index)
Source: Authors’ calculation
Chart 5 – Herfindahl-Hirschman Index calculated for geopolitical blocs
(index)
Source: Authors’ calculation
Annex A: Trade and geopolitical data correspondence
The analysis in our paper is based on the classification of countries into several groups based on their voting in the UN General Assembly. The non-trivial problem we had to address was that the set of countries with trade data and the set of countries with voting data did not correspond accurately. There are two main reasons for this: (i) the trade data include the dependent territories of some countries (mainly the United Kingdom, France and the Netherlands) and (ii) the trade data contain data on political entities with questionable status that are not represented in the UN.
The case of dependent territories can be easily solved: we assign them to the geopolitical bloc of their mother country. We deal with political entities in a disputed position as follows: if the entity is under the military or political control of another state, we consider trade with this entity to be part of trade with the controlling state. We thus consider trade with Western Sahara as part of trade with Morocco and trade with the Palestinian territories as part of trade with Israel.
This leaves three political entities that cannot be classified on the basis of voting: Taiwan, Kosovo and Venezuela. The first two cannot vote in the UN, so we are unable to include them in geopolitical blocs on the basis of archetypal analysis. We address this as follows: Taiwan – due to its economic and military ties with the USA – is included in a group of which the USA is also a member. Kosovo is included in a group comprising Albania on the basis of linguistic foundations. We have no voting record for Venezuela in our data, so it cannot be included in any bloc on the basis of archetypal analysis. Given its political links, we decided to include Venezuela in the bloc with the Russian Federation. In any event, trade with these territories is not significant enough for this choice to significantly influence the conclusions of our article.
Keywords: Globalisation, international trade, concentration of international trade, fragmentation of international trade
JEL Classification: C46, F14, F15
[1] The volume of international trade is calculated as the average of exports and imports, excluding significant re-exports or imports for re-exports. Data from the World Trade Organisation (WTO). Global GDP is at 2011 prices, is adjusted for inflation and also takes into account differences in living standards across countries. The source is Our World In Data based on data from the World Bank and Maddison Project: Database of Historical Development 1870–2015. The source of the data for 2016–2022 is the GDP growth rate at constant 2015 prices from the World Bank WDI. However, data from different sources need to be compared very cautiously due to substantial methodological differences.
[2] The author defines war as active conflict that has claimed more than 1,000 lives. A similar figure is provided by Lichtenstein (1976). The author cites a work by the Swiss Federal Statistical Office, according to which there have been only 292 war-free years in 5,000 years of documented human history. In the other years, 15,513 large or small wars took place, costing the lives of 3.64 billion people!
[3] Geopolitical coalitions can change over time. For the purposes of this article, we use the voting data for a very recent period to obtain an up-to-date picture relevant to the present.
[4] There are similarities and differences between archetypal analysis and other unsupervised classification algorithms, such as cluster analysis. The common thing is that these methods can be used to classify units into different groups. The main difference is that cluster centres are usually in local data centres. Archetypes, on the other hand, are placed at the edges of the data, as they represent “pure” types. This is why each unit can be represented as a convex combination of archetypes. This is impossible in a cluster analysis, precisely because cluster centres are located in the middle of local averages. We used the R package by Eugster and Leisch (2009) to calculate the archetypes. A cluster analysis was used by us in Brůha and Babecká Kucharčuková (2017), and focused on examining the resilience of EU Member States to the economic and financial crisis of 2008–2009.
[5] The usual criterion is the residual sum of squares, i.e. the remainder that is not explained by archetypes. The number of archetypes is usually taken as the highest value after which there is no significant decrease in the residual sum of squares. There are four archetypes for our voting data.
[6] What is surprising is the relatively high number of resolutions on Middle Eastern issues. In our sample (January 2022 to August 2023) there were 16 – many more than, for example, the number of resolutions relating to the Russian Federation’s aggression against Ukraine, of which there were six in this period. Due to the high number of votes on Middle Eastern issues, the algorithm has allocated the USA and Israel to a special group.
[7] Annex A discusses further details of the links between international trade data and the division of countries into geopolitical blocs.
[8] The high index volatility probably reflects the much higher sensitivity of trade in intermediate goods to domestic and foreign economic activity compared to trade in other types of goods, see Babecká Kucharčuková and Brůha (2020).
[9] However, the high concentration values for exports of intermediate goods do not necessarily reflect geopolitical considerations: they may result from the fact that exports of these goods are naturally oriented to developed countries that also belong to the friendly bloc II. This explanation cannot be used for other types of goods.
[10] One spectacular case might be the diplomatic and economic pressure applied by China to Lithuania after the opening of the Taiwanese embassy in Vilnius. This pressure was also exerted indirectly through pressure on German companies exporting to China not to use components made in Lithuania.
