The euro and us: Are living standards in the EU regions converging?
This blog article from our series “The euro and us” focuses on an area that affects every European: the prosperity of the region in which they live. An assessment of economic performance at the regional level in selected EU countries over the quarter-century of the Eurozone’s operation shows that while regional disparities in traditional EU member states (Germany, Austria and Portugal) and, in the second half of the period under review, in Slovakia, are generally decreasing, those in countries that joined later (the Czech Republic, Hungary and Romania) are widening. This is particularly true for the differences between the capital cities and the other regions of these countries. The article also highlights the importance of EU regional policy, which has undoubtedly mitigated traditional agglomeration effects.
What are the dominant forces in the EU’s regions? Concentrative forces towards existing centres, or dispersal ones? In the EU, as in other parts of the world, there are two traditional processes that affect the concentration of people and wealth. The first leads to agglomeration effects, i.e. the migration of people to narrower geographical areas (typically capital cities and their suburbs), while the second is linked with dispersal effects, i.e. a decline in the concentration of people. In the language of regional (spatial) economics, agglomeration forces work on both the demand side (firms want to be located in places where labour is available) and the supply side (selling in agglomerations where total purchasing power is high and transport costs are minimal). Historically, these forces, resulting mainly from natural economies of scale, have been dominant. Dispersal forces act in the opposite direction, lowering the concentration of people in city centres. Dispersion forces arise due to, for example, efforts to prevent negative concentration effects (such as air pollution, light pollution and noise), which lead people to leave large agglomerations.
EU regional policy is key! Supporting regional growth and reducing wealth disparities between EU regions is a key area of EU economic policy. The balance between agglomeration and dispersion forces and the resulting distribution of wealth among regions[1] can be influenced to a large extent by regional policy. By intentionally supporting less developed regions, regional policy evens out economic conditions and motivates both people and businesses to stay outside the centres. The largest agglomerations in Europe can be identified using night-time satellite images (see Chart 1). The wealthy, densely populated regions lie close to each other and form the engine of the European economy, whereas the poor, sparsely populated regions are geographically remote. This makes it sensible to ignore national borders and think more regionally when considering the distribution of economic activity in Europe.
Chart 1 – Europe at night
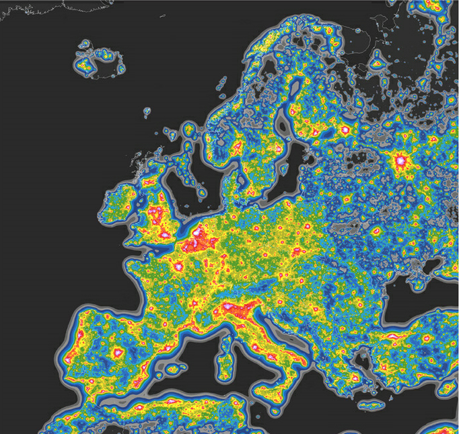
Source: ScienceAdvances,https://advances.sciencemag.org/content/2/6 /e1600377
Note: White and red areas indicate the greatest amount of artificial light, i.e. city agglomerations. Black areas show areas with natural darkness.
The largest share of funds disbursed from the EU budget is allocated to regional policy.[2] Regional policy is supported mainly from EU structural and investment funds, which have been significantly strengthened by the adoption of NGEU (NextGenerationEU).[3] These funds make up nearly 60% of the multiannual financial framework. The wealth indicator used for regions in decisions on the allocation of structural funds is GDP per capita in purchasing power parity (PPP) at the level of NUTS 2 regions.[4] For regional policy, the reference value is the EU average. NUTS 2 regions that have a per capita GDP of less than 75% of this average are given priority in the allocation of European structural funds. By contrast, the Cohesion Fund is designed to support poorer countries as whole entities, the reference value for support being gross national income per capita that is less than 90% of the EU average.
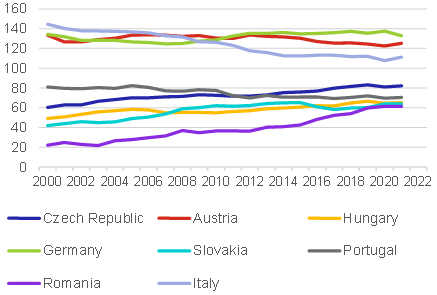
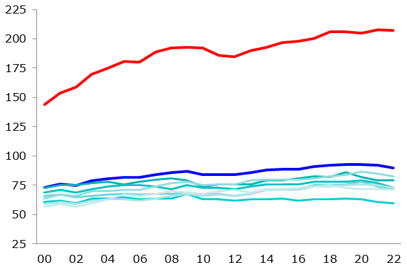
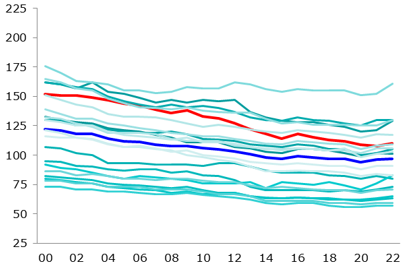
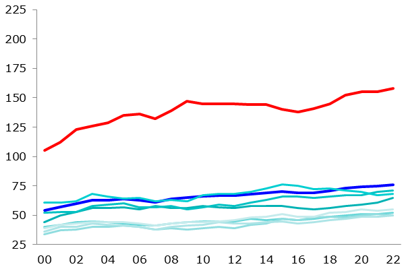
Are countries and regions converging? Turning our metaphorical microscope from the national to the regional level allows us to see whether the convergence of countries is being driven equally across regions or only by some of them. The evolution of GDP per capita in PPP for the NUTS 2 regions of selected EU countries[5] shows that in all the countries under review except Germany the capital city is substantially wealthier than the nationwide average (see Chart 2). This difference is more than double and persisting in the newer EU member states (although it has been decreasing in Slovakia since 2017), while it is markedly smaller and decreasing in the traditional EU countries monitored (Portugal and Austria). Despite the growing disparities between the capitals and other regions of the Czech Republic, Hungary and Romania, the wealth of most of the regions of these countries and thus of their economies as a whole has been growing faster than the EU-28 average (Chart 3). The situation is rather different in Italy, where GDP per capita was flat over the period 2000–2021 and therefore decreased compared with the EU-28 average. Chart A1 in the appendix offers a view of real GDP at the regional level for individual countries. In relation to the EU average, the overwhelming majority of the regions of Germany, Austria and Italy have levels above 75%. In the other countries monitored, only some regions – mainly capital cities – are above this reference value.
Chart 2 – Ratio of real GDP per capita in PPP in the capital city to the nationwide average
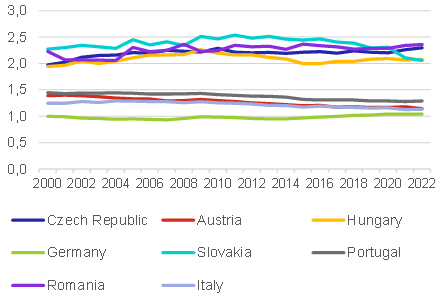
Source: Eurostat, CNB calculation
Chart 3 – Real GDP per capita in PPP, nationwide average
(index, EU-28 = 100)
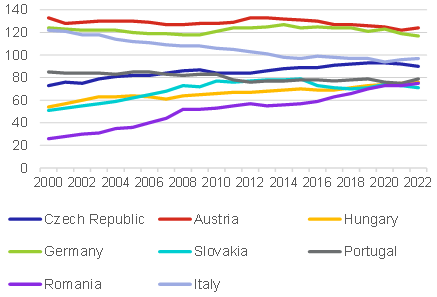
Source: Eurostat, CNB calculation
Is it more appropriate to compare at PPP or at the market exchange rate? Using GDP in PPP rather than GDP converted into a reference currency (EUR) at the market exchange rate gives rise to some distortion of the results. It leads to overvaluation of the results for the newer EU member states (which generally have a lower price level than the EU average) and to undervaluation of the results for the traditional EU countries. This is due to the PPP calculation mechanism itself, which takes into account, for example, income and expenditures of the population that are de facto not taken into account in the currency’s market exchange rate, such as the size of subsidies provided, the breadth of the administered price segment, differences in the rate of taxation and the level of social transfers. Conversely, the exchange rate based on PPP does not reflect current demand for the currency on the foreign exchange market, including, for example, global sentiment. Nevertheless, GDP per capita in PPP remains the reference indicator for EU regional policy, so it is important to track it.
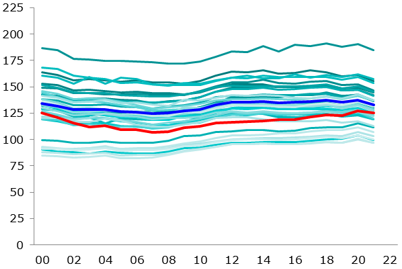
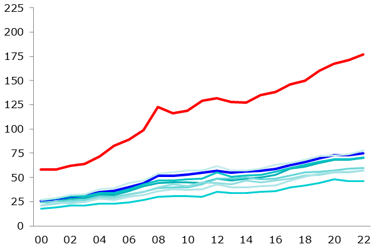
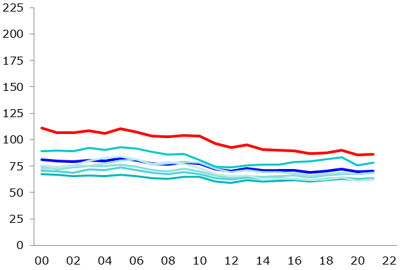
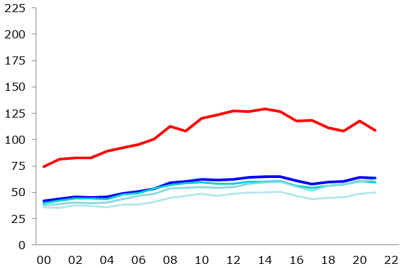
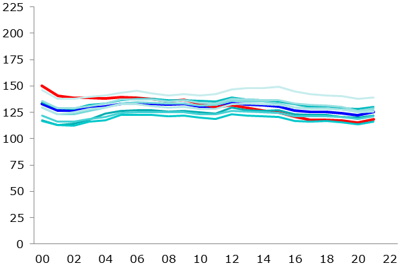
GDP per capita in PPP can be compared with household income per capita in PPP to obtain a rather more realistic picture of the regional disparities within individual countries. When we compare the two indicators, it is clear that the differences between the capital city and other regions of the country are smaller in the case of per capita income (see Chart 4) than when using GDP (see Chart 2). This may be because company headquarters are usually located in the capital (often the largest) cities. This overestimates the reported value of GDP in the capital (largest) city and conversely underestimates that in the surrounding regions. Similarly, it may be that many residents work in the capital city but have their place of permanent residence outside its boundaries. One may therefore observe greater equality in household income per capita between the capital and other regions than when using GDP. However, differences in household income per capita between countries persist (see Chart 5). The exception is Italy, where income at the national level is flat. Chart A2 shows household income at the regional level for the individual countries. Significant diversity among regions is apparent from this chart. The exception is Italy, where national incomes are declining relative to the EU-28 average. Conversely, the newer member states are approaching the EU average. Chart A2 shows household income at the regional level for individual countries. This provides a deeper insight into the individual countries and confirms, for example, the prominence of wealthy agglomerations around the capitals (with the exception of Germany). It also illustrates that the decline in income in Italy is de facto spread across all regions, including the Rome agglomeration. Overall income stagnation is characteristic of Austria and Portugal. This chart also shows at a glance that there is considerable income heterogeneity across regions in Italy and Germany. In contrast, Austria has the lowest regional income disparities. For the newer member states, household income growth is similar to that of GDP per capita, but less intense and with fewer regional disparities, confirming ongoing, albeit relatively slow, convergence.
Chart 4 – Ratio of household income per capita in PPP in the capital city to the nationwide average
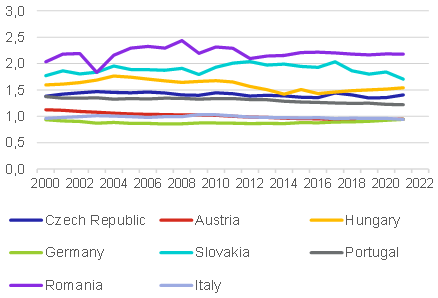
Source: Eurostat, CNB calculation
Chart 5 – Household income per capita in PPP, nationwide average
(index, EU-28 = 100)
Source: Eurostat, CNB calculation
Looking across the countries under review, it is also evident that the poorer the country, the more visible the disparities between the capital and regions. The biggest gaps in both GDP per capita (Chart 2) and household income (Chart 4) are in Romania, followed by roughly similar differences in Hungary and Slovakia, then the Czech Republic and Portugal. On the other hand, in Germany, Italy and, to a certain extent, Austria, the disparities between the capital (largest) city and other regions are negligible or often indistinguishable (see also Chart A1 and A2).
Beta- and sigma-convergence are used to assess the evolution and level of real convergence across regions. These concepts will be familiar to the informed reader. They are based on neoclassical economic growth theory.[6] Beta-convergence allows us to assess whether poorer regions are catching up with wealthier ones, while sigma-convergence is used to assess the degree of convergence across regions and over time. So, if the standard deviation between regions decreases (increases), the degree of convergence is higher (lower). The time period from 2000 to 2021 makes it possible to assess developments both before and after the outbreak of the global financial and economic crisis and European debt crisis, followed by the Covid-19 pandemic.
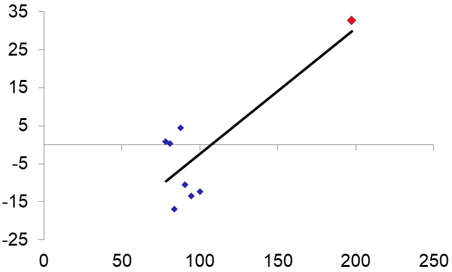
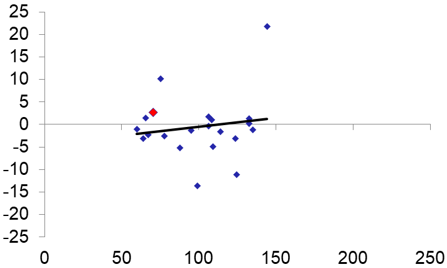
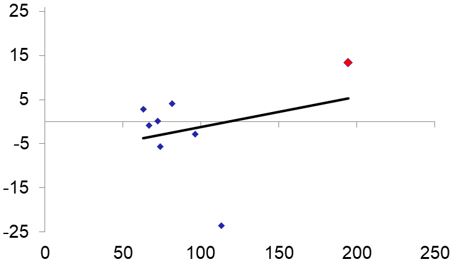
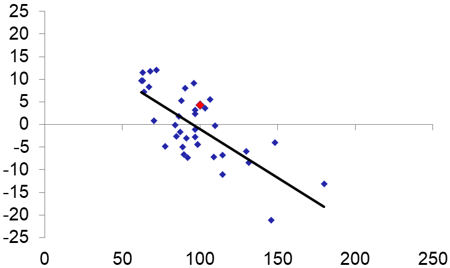
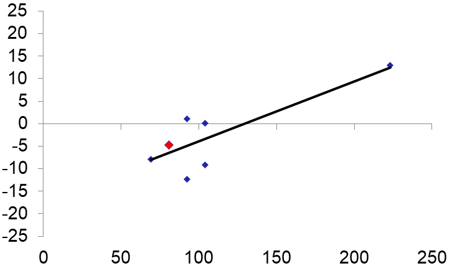
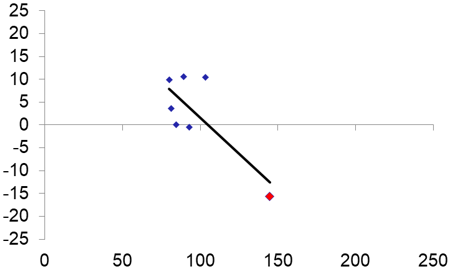
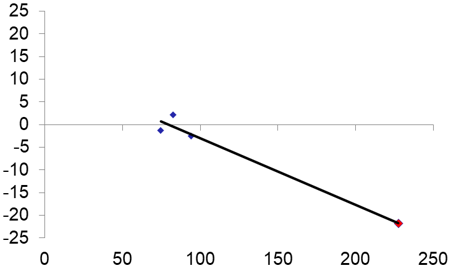
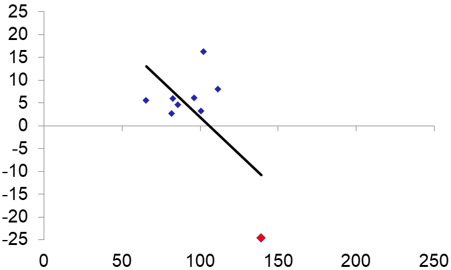
What did beta-convergence reveal? The beta-convergence results show that while the regions of most traditional EU countries converged in the period under review, the disparities between regions in the newer member states, with the exception of Slovakia, increased. Chart A3 shows the relationship between the initial GDP per capita of each region and the cumulative growth of its GDP per capita in the period under review. In Germany, Portugal, Austria and Slovakia, faster growth was observed for regions with lower initial GDP (a negatively sloped trend line). These poorer regions thus converged towards the wealthier ones in this period. In the case of Italy, economic activity per capita stagnated or fell relative to the EU-28 average, while no convergence was observed at the regional level: the trend line on Chart A3 even has a positive, though insignificant, slope, indicating no relationship between initial and accumulated GDP growth per capita. The Czech Republic, Hungary and Romania (see Chart A3), by contrast, saw beta-divergence, despite significant growth in economic activity per capita, with wealthier regions – especially the capitals – growing faster than poorer ones on average.[7] Table 1 depicts the evolution of beta-convergence over time for regions within countries and groups of countries. It shows that in Germany and Portugal beta-convergence between regions was already going on before the crisis, while in Slovakia such convergence is only apparent after the crisis. The results build on the findings of Alcidi (2019) and Monfort (2020), who identified beta-divergence of the regions in the countries of Eastern and Southern Europe over the period 2000–2015 and 2000–2018 respectively, though with the question of whether it will continue. Regional disparities therefore persist in the countries listed.
Table 1 – Beta-convergence of real GDP per capita at the regional level
| 2000–2010 | 2011–2022 | 2000–2022 | Number of regions | ||||
|---|---|---|---|---|---|---|---|
| CZ | 0.50 | *** | 0.16 | *** | 0.16 | *** | 8 |
| HU | 0.47 | *** | 0.04 | 0.04 | 8 | ||
| RO | 1.19 | *** | 0.33 | *** | 0.33 | *** | 8 |
| SK | 0.75 | *** | -0.34 | *** | -0.34 | *** | 4 |
| AT | -0.13 | -0.21 | -0.21 | **** | 9 | ||
| DE | -0.14 | *** | -0.13 | *** | -0.13 | *** | 38 |
| IT | -0.13 | *** | -0.05 | -0.05 | 21 | ||
| PT | -0.16 | * | -0.21 | ** | -0.21 | ** | 7 |
Note: The table shows the beta coefficients (the slope of the curve) for the given period. Negative, significant values express convergence. The newer member states with the exception of Slovakia show an absence of beta-convergence in all periods. Germany has the largest number of regions (38), while Slovakia, for example, consists of only four regions. *** 1% level of statistical significance, ** 5% level of statistical significance, * 10% level of statistical significance.
Source: Eurostat, CNB calculation
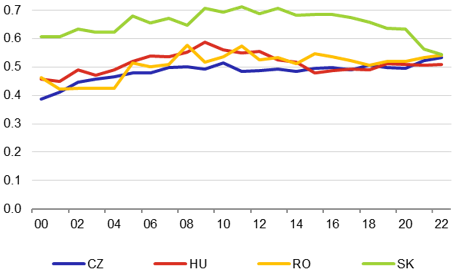
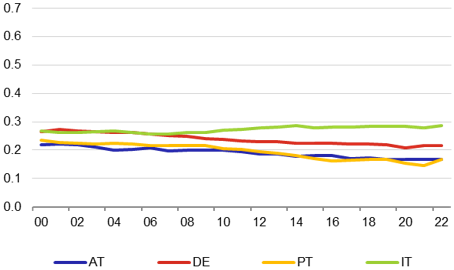
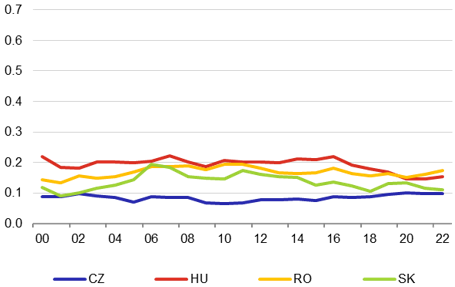
And what other information about the behaviour of regions does sigma-convergence provide? The traditional EU countries also fare better in terms of sigma-convergence. Portugal and Austria have the highest sigma-convergence between regions at country level. The degree of convergence of the German regions is only slightly lower, while growing divergence between regions is observed in Italy (see Chart A4; all regions – lower values mean higher convergence). In the second half of the 2011–2021 period, there was some convergence of the regions in Hungary and Slovakia in particular, and a hint of convergence is also apparent in Romania. The difference compared with the above traditional EU economies is still significant, by multiple orders of magnitude. If we hypothetically exclude the region of the capital city, the differences inside the newer member states are comparable with those in the traditional EU member states and even smaller than those in Germany and Italy (see Chart A4).
So are the regional disparities in the newer EU countries larger than those in the traditional ones? Our analysis of wealth in the individual regions of selected countries shows that in the newer EU member states (with the exception of Slovakia) there are still significant regional disparities, which are also widening. In Slovakia, the regional disparities decrease in the second half of the period. While most of these countries’ regions experienced faster growth in wealth than the EU-28 average, the growth of some regions, especially the capital cities, was stronger than that of the rest. Conversely, in traditional EU countries, the differences between NUTS 2 regions are less significant and gradually decreasing. The newer EU countries should therefore make better use of the common European cohesion funds to avoid a further widening of the gap between their capitals and other regions. Growing divergence between regions may undermine poorer regions’ support for further political and economic integration.
Regions and countries are gradually becoming more prosperous, but at different rates. Though the deepening economic integration in Europe is gradually erasing the wealth gaps between states, the geographical distribution of economic activity is increasingly concentrated in already existing agglomerations. The inhabitants of these agglomerations enjoy higher incomes and lower unemployment rates, while the opposite is true of the poorer regions. The challenge for EU regional policy is therefore to change these processes and bring the level of wealth in the regions closer to that in the capital (largest) cities.
Jan Babecký – Czech National Bank (jan.babecky@cnb.cz) and Luboš Komárek – Czech National Bank (lubos.komarek@cnb.cz) and Faculty of Social Sciences at Charles University, where he teaches courses on European economic integration and European economic policies. The views expressed in this article are those of the authors and do not necessarily reflect the official position of the Czech National Bank. The authors would like to thank many colleagues from the CNB and academia for their valuable comments.
References
Alcidi, C. (2019): Economic Integration and Income Convergence in the EU. Intereconomics 54(1), pp. 5–11.
Barro, R. J., Sala-i-Martin, X. (1992): Convergence. Journal of Political Economy 100(2), pp. 223–251.
Monfort, P. (2020): Convergence of EU Regions Redux: Recent Trends in Regional Disparities. Working Paper No. 02/2020: European Commission.
[1] EU regions are divided into three categories: less developed, in transition, and more developed.
[2] See https://commission.europa.eu/strategy-and-policy/eu-budget/long-term-eu-budget/2021-2027/spending/headings_en
[3] Expenditure on cohesion policy for the period 2021–2027 amounts to EUR 426.7 billion and is increased by funds from the NGEU (EUR 776.5 billion), making a total of EUR 1203.2 billion.
[4] NUTS (Nomenclature des unités territoriales statistiques) indicates the nomenclature of statistical territorial units. The Czech Republic is divided into eight NUTS 2 regions: CZ01 Prague, CZ02 Central Bohemia, CZ03 Southwest, CZ04 Northwest, CZ05 Northeast, CZ06 Southeast, CZ07 Central Moravia and CZ08 Moravian-Silesian.
[5] Austria, Germany, Italy, Portugal, the Czech Republic, Romania, Slovakia and Slovenia.
[6] See, for example, Barro and Sala-i-Martin (1992). For an application of beta- and sigma-convergence in regional development, see, for example, Monfort (2020).
[7] For the newer EU member states, the slope of the regression line is strongly influenced by the capital, which is markedly wealthier than the other regions and may have a greater business cycle amplitude. If capital cities were excluded from the regressions, the slope of the line would be negative, especially for the Czech Republic and Hungary, i.e. the poorer regions would be converging to the wealthier ones.
Chart A1: Real GDP per capita in PPP
(EU28_2020 = 100%)
Czech Republic
Italy
Hungary
Germany
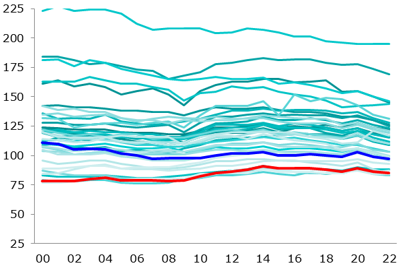
Romania
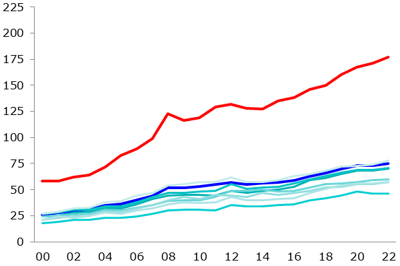
Portugal
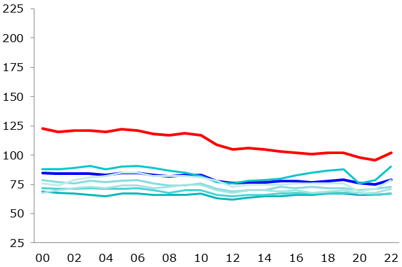
Slovakia
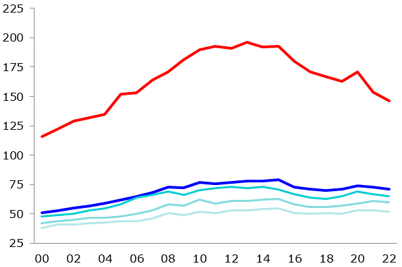
Austria
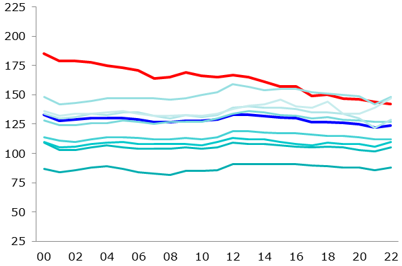
Source: Eurostat
Note: The chart shows GDP per capita in selected countries of the EU at the NUTS 2 regions level. The red line shows the “capital city” region, while the blue line shows the national level (for comparison). The data are available up to 2022.
Chart A2: Household income per capita in PPP
(EU28_2020 = 100%)
Czech Republic
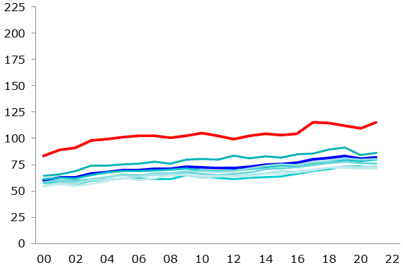
Italy
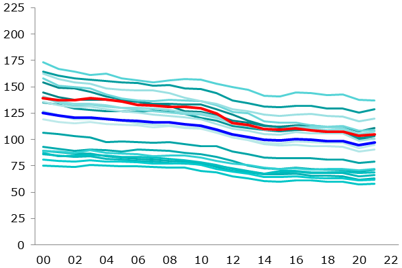
Hungary
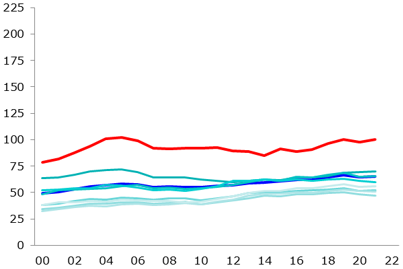
Germany
Romania
Portugal
Slovakia
Austria
Source: Eurostat
Note: The chart shows household disposable income per capita in selected countries of the EU at the level of NUTS 2 regions. The red line shows the “capital city” region, while the blue line shows the national level (for comparison). Income data are available up to 2021.
Chart A3: Beta-convergence of real GDP per capita at the regional level
(2000–2022)
Czech Republic
Italy
Hungary
Germany
Romania
Portugal
Slovakia
Austria
Source: Eurostat, CNB calculation
Note: The chart shows the relationship between the change in GDP per capita compared with the national average for NUTS 2 regions for the period 2000–2022 (y-axis) and its initial level in 2000 (x-axis), national average = 100%. Capital cities are indicated in red.
Chart A4: Sigma-convergence of real GDP per capita at the regional level
(2000–2022)
Czech Republic, Hungary, Romania, Slovakia – all regions
Austria, Germany, Portugal, Italy – all regions
Czech Republic, Hungary, Romania, Slovakia – excluding “capital city” region
Austria, Germany, Portugal, Italy – excluding “capital city” region
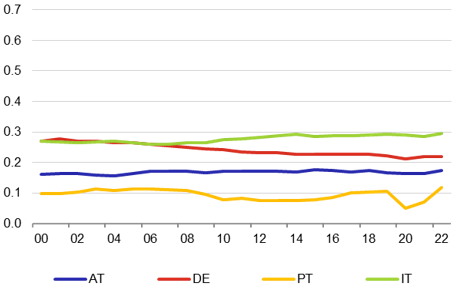
Source: Eurostat, CNB calculation
Note: The chart shows the sigma coefficient (the standard deviation of regional GDP per capita in PPP relative to the country average over time at the NUTS 2 level. Lower values mean a higher degree of convergence.
