The fading of the inflation tsunami: Causes and outlooks
The early 2020s saw a series of long-unseen shocks in rapid succession that caught us off guard (the Covid-19 pandemic, the energy and security crises related to Russia’s attack on Ukraine). They resulted in an unprecedented surge in prices. On the supply side, the main causes of this surge include problems in global supply chains and massive increases and subsequent volatility in energy and commodity prices. Price increases were also stimulated by the demand side of the economy due to the shift in demand from non-tradables (part of the closed services sector) to tradables (electronics, for example). Demand stimuli were supported not only by a generous and relatively broad-based expansionary fiscal policy, but also loose monetary policy. Firms passed the price shock on to their customers in the form of higher prices and consumer sentiment deteriorated due to high inflation. This article sets out to give a brief summary of the factors underlying the unusually strong surge in inflation and, using the available data on firms’ pricing behaviour, demonstrate that the subsiding wave of inflation should really be a thing of the past unless another external shock hits in the near future.
Why was there an inflation tsunami?
A period of relative calm came to an end in early 2020. The Covid-19 shock followed by the energy shock – amplified by Russia’s aggression in Ukraine – led to an unprecedented sharp rise in prices. In the language of meteorologists, the shocks in the commodity, production and distribution sectors across countries and continents triggered an inflation tsunami. The tsunami swept through the majority of countries in the world, hitting Europe perhaps even harder than elsewhere. There are two main reasons for this: First, the vast majority of European countries are net importers of energy and commodities (which are traded on world markets in dollar and not in euro, the domestic currency of most European countries). Second, European countries are geographically closest to the war in Ukraine and, at the same time, were (perhaps irresponsibly) dependent on energy supplies from Russia. However, it is important to look at the detailed causes of extreme price growth in the evolution of supply (particularly by firms) and demand (from households, firms and the state) and their interaction amid a highly visible role of governments and central banks[1].
On the supply side, global inflation was at first triggered by gradually increasing problems in global supply chains.[2] These had already started to appear just before the outbreak of the global Covid pandemic. They mainly involved problems in container transport, which were magnified by the temporary obstruction of the Suez Canal. The closure of plants during anti-pandemic shutdowns led to shortages of some components, especially chips. However, the growth in chip prices was also adversely affected by fires at chip manufacturers in Japan and Taiwan. This also showed that quickly building a chip-producing plant is not a matter of months, but of years. Chart 1 shows the monthly index of global supply chain pressures compiled by the New York Fed[3] and the sentiment index compiled by the European Commission. The chart shows that the start of 2020 saw the first, very severe supply chain crisis which peaked in late 2021 and early 2022. Pressures have gradually eased since then and the situation only returned to normal at the start of 2023.[4]
Chart 1 – Supply chain pressure indices
(standard deviation from average)

Source: Fed, European Commission
The second major factor underlying the inflation tsunami on the supply side was a surge in prices of commodities (industrial metals and food commodities) and energy (natural gas, oil and electricity accompanied by a sharp increase in prices of emission allowances). The growth in energy prices escalated mainly due to Russia’s attack on Ukraine on 24 February 2022. This growth was also stimulated by increased demand, or rather, forced demand amid faster replenishment of gas storage facilities in individual countries. The demand was fuelled by concerns about keeping households and industry running, especially during the heating season. Chart 2 shows that the highest price increases were observed at the start of the second half of 2022. Countries ended their strong commodity dependence on Russia within a short period of time (this dependence was almost 100% for some countries and commodities), most of them doing so surprisingly quickly and successfully.
Chart 2 – Prices of selected commodities
(index: average 2019 = 100)

Source: Bloomberg
Increased demand continued to stimulate inflation
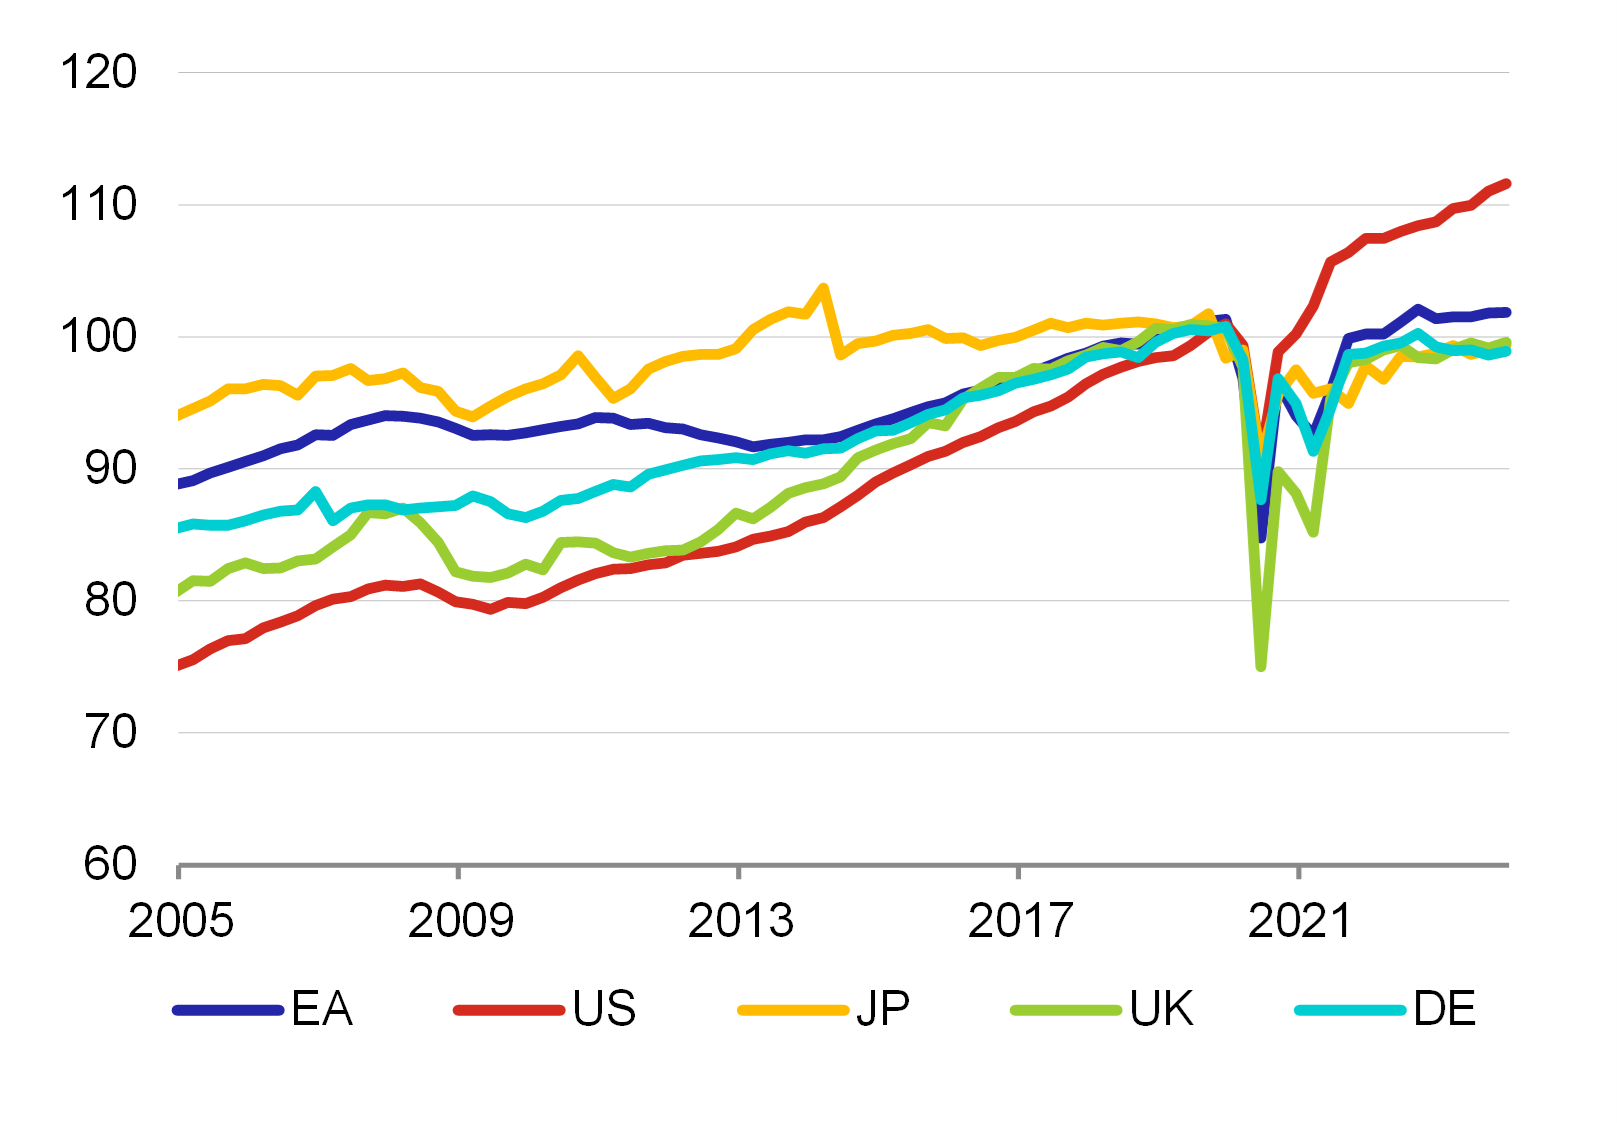
Epidemiological restrictions during Covid led to a sharp drop in demand for non-tradable goods and activities involving larger numbers of people. The services sector was hardest hit. For a certain period of time, people were unable to travel, go to restaurants, attend sports events or meet up… The money saved as a result turned into “forced savings” and households’ saving rate increased significantly (see Chart 3). People subsequently used these funds for items they had put off buying for a long time or things they urgently needed for day-to-day life during the Covid pandemic (such as laptops and other devices for childrens’ online lessons during Covid, working from home, etc.). Following a forced decline in consumption due to shutdowns, consumption was re-channelled to the tradables sector which was, however, already burdened by the above-described problems on the supply side of the economy. This again stimulated inflation.
Chart 3 – Household saving rate
(%)

Source: Eurostat, ons.gov.uk, FRED, esri.cao.go.jp
Note: Seasonally adjusted data.
Chart 4 – Household consumption
(index; 2019 average = 100)

Source: Oxford Economics, authors’ calculation
Note: Quarterly data.
Demand was also significantly boosted by governments with their generous and overly broad-based support of households and firms that received “free” money without having to produce anything. Increased government support, which is necessary and natural in times of crisis, and not only from the point of view of mainstream economics, had to be “by definition” reflected in a deterioration in public finances. However, to finance this support of households and firms, governments borrowed funds on financial markets at a non-zero interest rate, which raised their deficits and hence also debt burden. A look at the soundness of public finances across European countries shows that all countries have slipped into the “sick” category. For this reason, countries in the EU have temporarily stopped being assessed in terms of their compliance with the fiscal deficit criterion (the EC started to apply the general escape clause (GEC), as de facto all countries ceased to comply with the criterion by a significant margin and would thus be subject to excessive deficit procedures (EDP)). The central banks were not left behind with their support either, having loosened the monetary policy probably too much.[5]
The previous crises had a more or less symmetrical effect on economic sectors and had no clear “winners” and “losers”. However, the Covid period and the energy and security crises had a different effect.[6] We can see – and this is something we all vaguely remember – that there have been clear winners and losers since 2020. The losers are those parts of the services sectors which were particularly hard hit by the shutdowns, i.e. the above-mentioned travel and hospitality sectors, sports matches, cultural performances and other events for the public. The winners – some deservedly, others whose growth in profitability did not correspond to increased investment or other efforts – include the pharmaceutical industry (vaccines and medicines), the IT sector (hardware and software, including programmes for remote communication) and partly also the energy and banking sectors.[7] Price rises triggered by a drop in supply amid an almost simultaneous rise in demand were used by some firms to increase margins and their profitability disproportionately. As a result, a new entry was added to economic dictionaries – greedflation. The term expresses firms’ excessive profit-seeking at a time of steeply rising prices and a misuse of a specific market situation (where there are no other suppliers or at times of extreme demand compared to other times). Firms can afford to raise prices in such situations, as their market share does not decrease at the same time. Price increases were also “abnormally” accepted by consumers, which brings us to another new dictionary entry – sympaflation, i.e. shoppers’ empathic understanding of price increases. This higher tolerance of price increases was as a result of people’s understanding (keeping local bakeries and restaurants afloat, for example) of the difficult situation faced by entrepreneurs due to shutdowns during the Covid-19 pandemic (exhaustion of financial reserves) and their understanding of price increases (growth in commodity and energy prices).
Firms’ pricing policy
The available literature shows that firms’ pricing policy used to be broadly stable but the period of high inflation led to visible changes in pricing. The behaviour of firms in the euro area is documented in great detail in a study by Fabiani et al. (2005), which drew on a questionnaire survey among more than 11,000 firms from the entire euro area. The study finds, among other things, that about one-third of firms applied time-dependent rules in price setting, while the rest used state-dependent factors. At the same time, it was more important to look to the future than the past when setting prices, so expectations played a big role here. Most firms in the euro area changed their prices less often than three times a year, with changes being less frequent especially in the services sector. When GDP weights are applied, the study finds that around 40% of firms changed their prices once a year. It may come as a surprise to economists that firms relied mainly on mark-ups and less on competitors’ prices in setting prices. The results of the survey also confirmed that prices are rigid to a certain extent, as firms changed their prices less often than they reviewed them. The results of a microeconomic survey by Alvarez at al. (2006) reveal that prices in the euro area change at less than half the frequency[8] of those in the USA. Putting it simply, in both economies, price changes were most frequent in the energy and food sectors and least frequent in the services sector. According to the study, there is no evidence that downward price rigidity is more marked than upward price rigidity in the two economies (the exception being the services sector). If prices do change, the changes are significant.[9] The study also shows that firms consider implicit contracts and interactions on the market to be more important than menu costs.
High inflation has forced firms to change their price more often, which is consistent with rational behaviour. Unfortunately, more recent surveys of price setting in the euro area are not available, and it would be too naive to expect nothing to have happened in the past 20 years. We can thus look for some indications in Bunn et al. (2023), who use data from surveys conducted regularly in the now non-EU Member State – the UK. The results of this survey show that even in 2019 (i.e. before the surge in inflation), the behaviour of firms in the United Kingdom was very similar to that of firms in the euro area. We can thus assume that company behaviour will be similar now and apply the results from the UK to the euro area. For example, the proportion of firms which set prices regularly and those which adjusted them in response to changes in external conditions was the same. Likewise, firms most often changed prices on an annual basis. However, the results of the 2022 survey showed that firms had started to change prices more often, with almost a quarter of companies stating that they change prices quarterly (see Chart 5).
Chart 5 – Typical price change frequency
(percentage of businesses)

Source: Bunn et al. (2023), Figure 3
Note: UK data.
Firms that change prices more frequently also make more significant price changes. However, price changes are applied with higher frequency in both directions, as these firms also lower their prices if inflation decreases. This is in line with the previously mentioned factor of mark-ups being crucial in determining pricing for firms. If prices of some inputs increase rapidly and firms want to maintain their mark-ups, they also raise their prices quickly, and vice versa. The high inflation observed in recent years resulted mainly from growth in commodity and energy prices. If we look at producer price inflation, we can see a very similar trend stemming from energy prices.
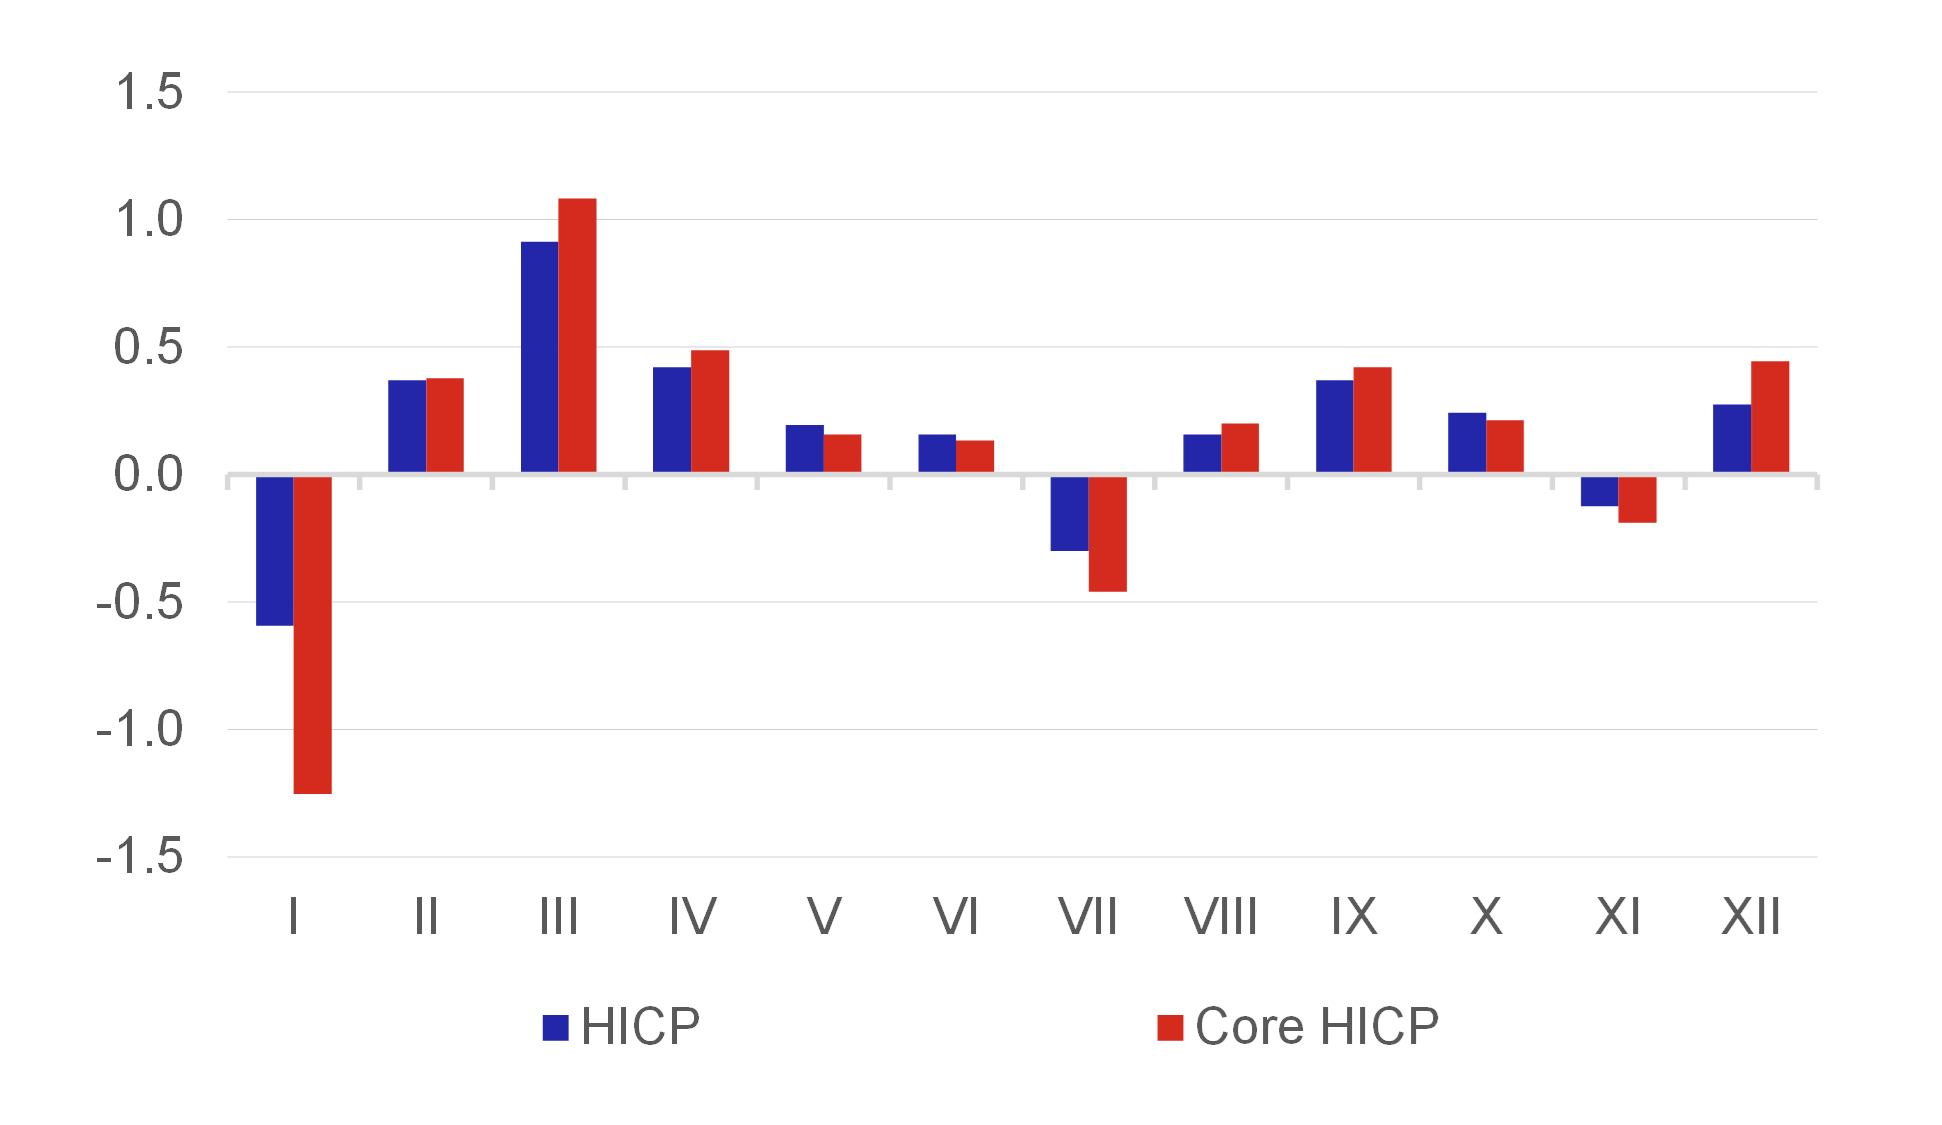
The turn of the year may be the ideal time for a change in prices but historical evidence tells a different tale. If up to now firms have changed prices most often once a year and 40% of them still do so regularly, we could assume that prices will always increase at the turn of the year and we will be able to observe the changes in the January inflation. However, this phenomenon does not apply to the euro area as a whole, although the situation varies from country to country. Nevertheless, a look at data makes it clear that month-on-month inflation follows a seasonal pattern (see Chart 6), i.e. there are months in which prices increase and months in which, conversely, they fall slightly. Paradoxically, on average, prices go down in January, which could be due to January sales. However, similar and even sharper decreases are observed in the case of core prices and there is no such thing as sales when it comes to services. The average month-on-month price change shows that upward repricing occurs most often in March.
Chart 6 – Seasonality of month-on-month inflation in the euro area
(%)

Source: Eurostat, authors’ calculation
Note: Seasonally unadjusted data.
Electronic vignettes and their use – a solution for the future? If electronic shelf labels linked to a retailer’s information system were used on a larger scale, this may result in prices being changed more often and probably by smaller amounts on average, as the well-known effect of menu costs would be tied to minimum costs (for example, according to the price elasticities obtained for individual products with the aim of maximising a retailer’s profit). One of the leading manufacturers of this system (Store Electronic System) sees the main benefit of the system in the above-mentioned guarantee of uniform prices in a shop and across shops (error minimisation), a reduction of operating repricing costs and above all the possibility of dynamically optimising everyday price strategies.
Future price expectations
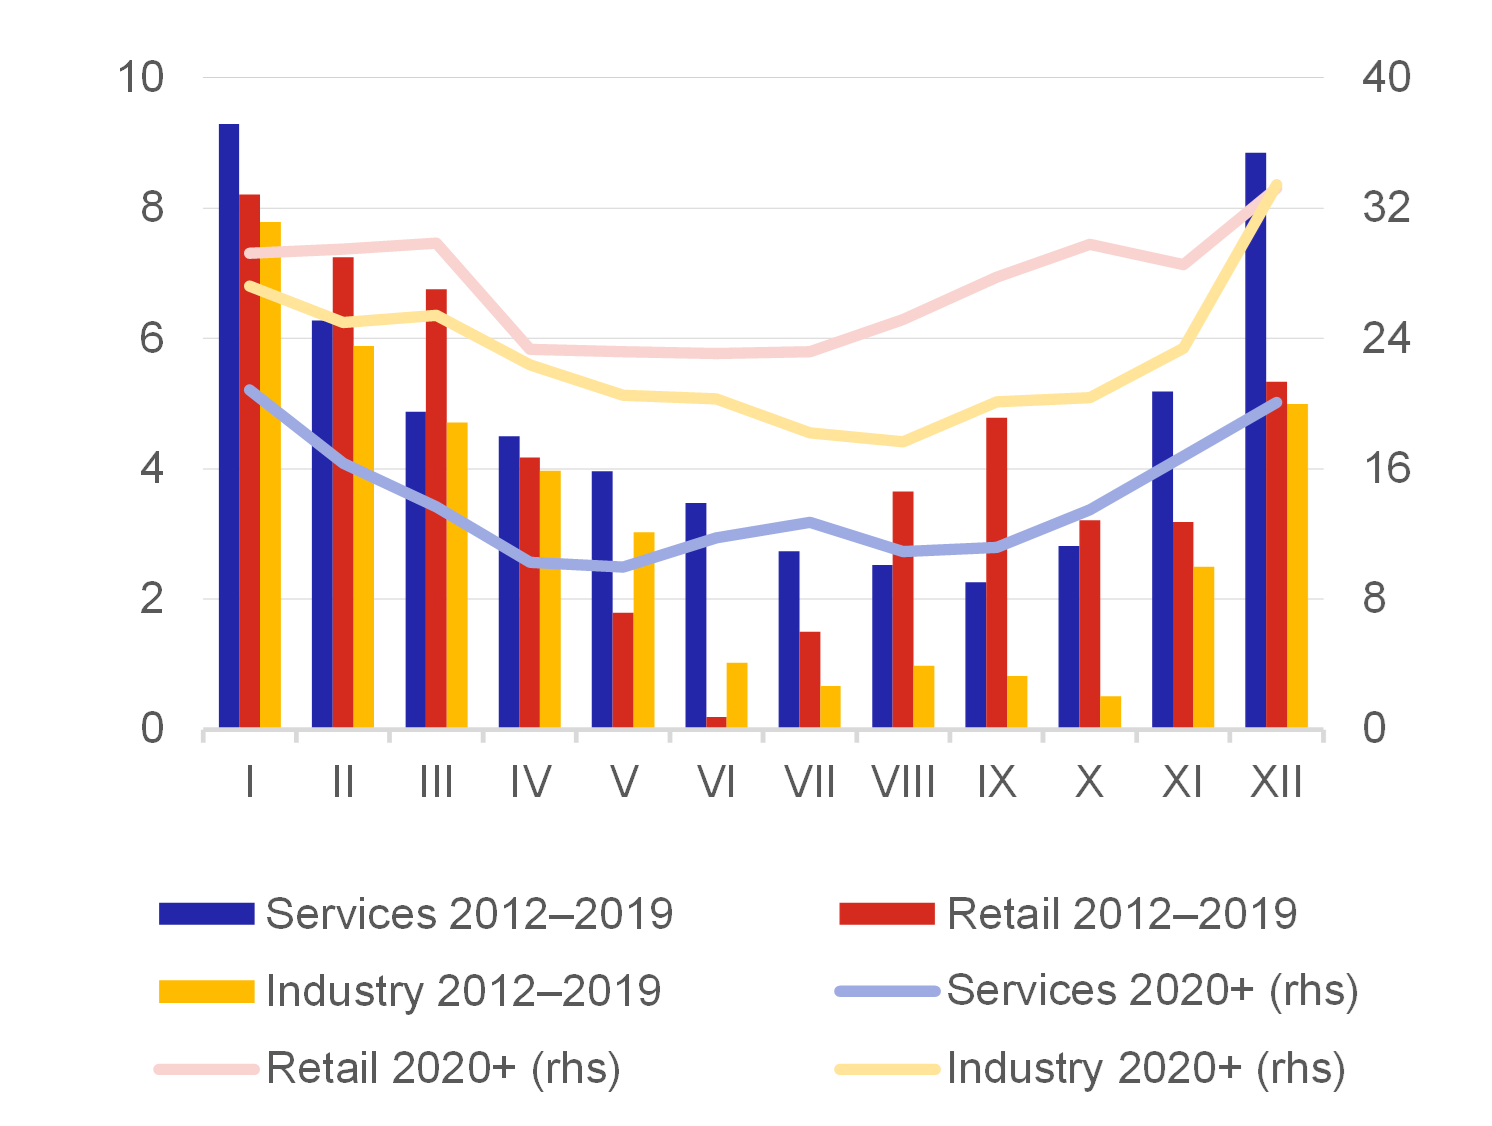
The European Commission’s survey may provide a forward-looking indicator of price changes in the euro area. Chart 7 shows how firms’ price expectations have changed over the recent inflation years. In the long period before the inflation wave caused by the Covid and energy crises, firms expected price changes to occur usually in spring. In addition, this share of companies was small overall, so the situation is different now. Not only has the share of firms expecting growth in prices in the next three months increased markedly in all the sectors under review and now represents about one-third of firms in retail, but expectations about price increases have been largely seasonal over the past three years and have been constant over time. The good news for price stabilisation is that if we look at seasonally adjusted data, we can see that no further price increases are expected in industry, for example, and those in retail fell sharply last year, and the situation is gradually returning to normal.
Chart 7 – Firms’ expectations about price changes
(the average balance of answers)

Source: European Commission, authors' calculations
Note: Expectations about price changes in the next three months.
The fact that the situation is returning to normal is evidenced by inflation momentum (see Chart 8). In the previous paragraphs, we looked in detail at inflation in individual months from the perspective of month-on-month data. However, such data may contain large swings and high-frequency noise, and isolated effects may distort the overall view of price signals. The second view most often followed by the media is conversely the annual price change (i.e. current prices versus prices a year ago). With annual inflation, however, there is the risk that one-off changes, for example, would affect the figure for the whole of next year. As a result, annual inflation may not give an accurate picture of the actual price situation. The middle-of-the-road approach adopted by economists is the monitoring of the inflation momentum in the form of, for example, average month-on-month inflation for three months or inflation over the past three months as compared to the previous three months. Such a view looks at short term developments and indicates the direction of price growth. Headline inflation in the euro area is thus beginning to approach the 2% inflation target and, from the point of view of the inflation momentum, it has already reached the target. Core inflation remains higher, but its momentum has also slowed very quickly.
Chart 8 – Inflation momentum in the euro area
(%)

Source: Eurostat, authors’ calculation
Note: Seasonally adjusted data. The momentum is the ratio of average inflation for three months to the average for the previous three months.
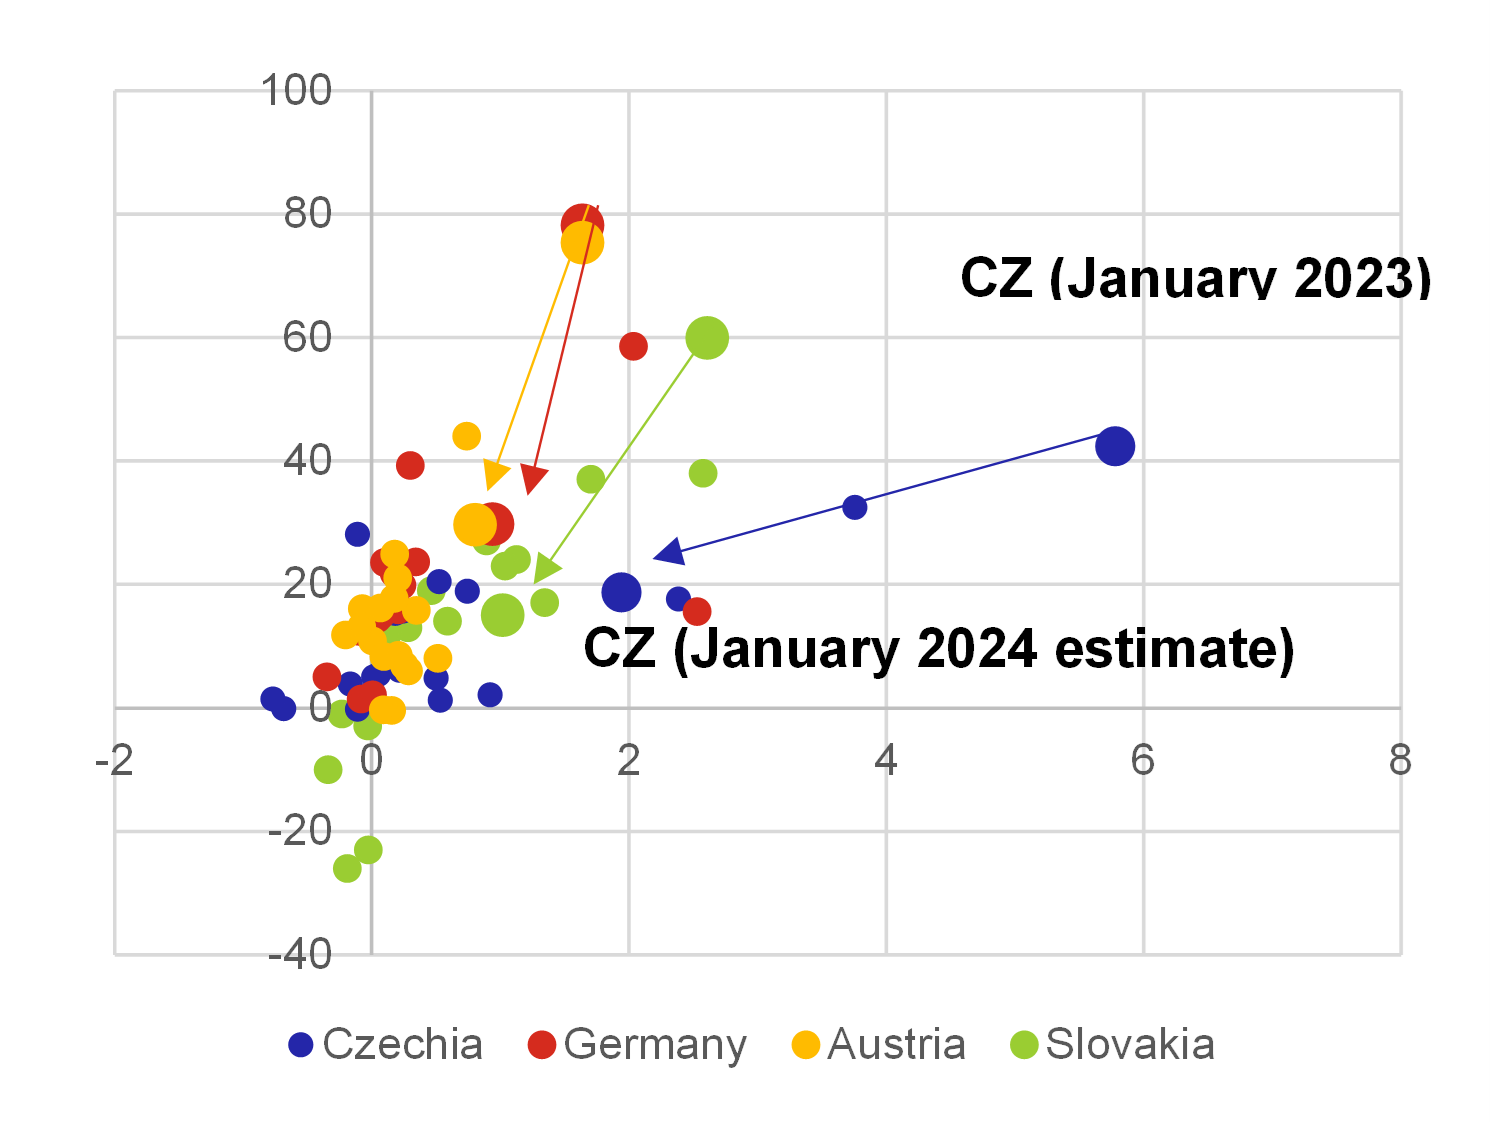
So how big will the next January repricing be in the euro area? The data on retail price expectations from October 2023 can provide us with some clue (see Chart 9), as we found that, historically, these expectations have been a good indication of the actual January repricing in the past. The more retailers expected prices to go up, the bigger the price hikes. In October 2022, for example, almost 80% of firms in Germany expected prices to rise and the actual seasonally adjusted growth in the HICP was one of the highest since 2005 (+1.7% month on month). By contrast, prices in Germany usually grew at a rate of one-third to one-quarter in this period. The data would then suggest that the pace of repricing would return closer to the historical average in January 2024 (the arrow is pointing down and to the left), although it will remain slightly elevated (outside the main cluster of dots). A similar shift compared to January 2023 is also observed in other countries. The January repricing will thus be noticeably significant but no longer historically high.
Chart 9 – Expected January repricing in the euro area
(y-axis: Expectations of retail price inflation in October of the previous year; x-axis: M-o-m change in HICP in January)

Source: Eurostat, European Commission, authors’ calculations
Note: Seasonally adjusted data.
Conclusion
The inflation tsunami was a result of the Covid, energy and security crises, i.e. extreme shocks. The price growth was driven by factors underlying supply-side constraints (problems in global production chains, sharp growth in energy and commodity prices) and a shift in demand from non-tradables to tradables. The demand side of the economy was further boosted by too generous and broad-based fiscal policy, for which governments had to borrow funds. Public finance deficits rose sharply, which led to a renewed discussion about their sustainability in some overindebted euro area countries. The economy was also stimulated by a very loose monetary policy – the rates were not only low globaly, but key central banks used unconventional policy measures as well.[10]
Firms’ pricing policy has changed compared to the pre-Covid period. External factors forced firms to change prices more often, which resulted in a high pace of price changes. Some firms probably took advantage of reduced supply and elevated demand to raise prices disproportionately (greedflation). Anecdotal evidence also indicates that consumers’ tolerance to price movements was higher than it would have been in “normal times”. The good news for future inflation is that adverse external effects are already gradually fading, as is the inflation wave. Firms’ expectations about price changes are thus also gradually changing. However, the current situation has implications for the future, when firms can be expected to change their prices more often.
The forward-looking indicators show that inflation not only in the euro area has already eased. If we look at firms’ expectations in the euro area about price changes in the next three months, we can assume that the situation is gradually returning to normal and that firms are no longer worried about further major changes. At the same time, the inflation momentum is falling and inflation is expected to return to the ECB’s 2% inflation target soon. Similiar development can be seen also in other parts of the world, where the inflation is getting back to inflation targets.
Written by Luboš Komárek and Petr Polák. The views expressed in this article are those of the authors and do not necessarily reflect the official position of the Czech National Bank. The authors would like to thank Soňa Benecká, Jan Hošek, Filip Novotný for their inspiring comments and discussions.
References
Alvarez, L. J., Dhyne, E., Hoeberichts, M., Kwapil, C., Le Bihan, H., Lünnemann, P., & Vilmunen, J. (2006). Sticky prices in the euro area: a summary of new micro-evidence. Journal of the European Economic association, 4(2-3), 575-584.
De Santis, R. A. (2023). Supply Chain Disruption and Energy Supply Shocks: Impact on Euro-Area Output and Prices. International Journal of Central Banking
Bunn, P., Bloom N., Mizen P., Ozturk, O., Thwaites, G. & Yotzov, I. (2023). Price-setting in a high-inflation environment. VoxEU Column. 7. srpna 2023. https://cepr.org/voxeu/columns/price-setting-high-inflation-environment
Fabiani, S., Druant, M., Hernando, I., Kwapil, C., Landau, B., Loupias, C., & Stokman, A. C. (2005). The pricing behaviour of firms in the euro area: New survey evidence. Working Paper 535, ECB, 2005.
Kucharčuková, O. B., Brůha, J., Král, P., Motl, M., & Tonner, J. (2022). Assessment of the Nature of the Pandemic Shock: Implications for Monetary Policy. Česká národní banka
Lünnemann, P., & Wintr, L. (2011). Price stickiness in the US and Europe revisited: evidence from internet prices. Oxford bulletin of economics and statistics, 73(5), 593-621.
Vermeulen, P., Dias, D. A., Dossche, M., Gautier, E., Hernando, I., Sabbatini, R., & Stahl, H. (2012). Price setting in the Euro area: Some stylized facts from individual producer price data. Journal of Money, Credit and Banking, 44(8), 1631-1650.
González-Torres, G., Gumiel, J. E. & Szörfi, B. (2023). Potential output in times of temporary supply shocks. ECB Economic Bulletin, Issue 8/2023.
Keywords: Inflation, pricing, price shocks
JEL Classification: D23, E31, L11
[1] Different views on shocks caused by covid-19 are presented by e.g. Kucharčuková a kol. (2022), González-Torres a kol. (2023) nebo De Santis (2023).
[2] Firms worldwide applied the just-in-time delivery system, which they have now replaced with the just-in-case model.
[3] It uses data on sea and air transport costs, the Purchasing Managers’ Index (PMI) and the ISM manufacturing index for seven economies (the euro area, China, Japan, South Korea, Taiwan, the UK and the USA) adjusted for demand effects.
[4] Pressures are currently rising due to the attack on Israel by the terrorist organisation Hamas, which indirectly led to assaults on cargo ships in waters near Yemen.
[5] See https://www.cnb.cz/cs/o_cnb/cnblog/Menova-politika-centralnich-bank-v-reakci-na-epidemii-koronaviru/ for the overview of the measures.
[6] See, for example, the prestigious annual symposium of central bankers in Jackson Hole, which was devoted to macroeconomic policy in an uneven economy (external link) in 2021. The symposia held in 2022 and 2023 also touched upon this “uneven” effect from various perspectives.
[7] The proponents of windfall tax also used this argument to justify its introduction.
[8] The exception is (consumer electronics) prices in online shops; see Lünnemann and Wintr (2011).
[9] The study also argues that the empirical results do not confirm the hypothesis of downward price rigidity.
[10] See e.g. https://www.cnb.cz/cs/o_cnb/cnblog/Jak-hluboko-vlastne-klesly-urokove-sazby-a-co-bude-dal/
